GeezerVisonThe World Wide Web, restored to 800 pixels of glory. |
| Home|About|Gaming cabinet|Archives|How it works|Starter sites |
GeezerVison is showing www.qcustomplot.com — Qt Plotting Widget QCustomPlot - Basic Plotting Basics of plotting with QCustomPlotThe tutorials use You can create a new graph in the plot via To make any kind of changes to the plot appear on screen, call // generate some data:
QVector<double> x(101), y(101); // initialize with entries 0..100
for (int i=0; i<101; ++i)
{
x[i] = i/50.0 - 1; // x goes from -1 to 1
y[i] = x[i]*x[i]; // let's plot a quadratic function
}
// create graph and assign data to it:
customPlot->addGraph();
customPlot->graph(0)->setData(x, y);
// give the axes some labels:
customPlot->xAxis->setLabel("x");
customPlot->yAxis->setLabel("y");
// set axes ranges, so we see all data:
customPlot->xAxis->setRange(-1, 1);
customPlot->yAxis->setRange(0, 1);
customPlot->replot();
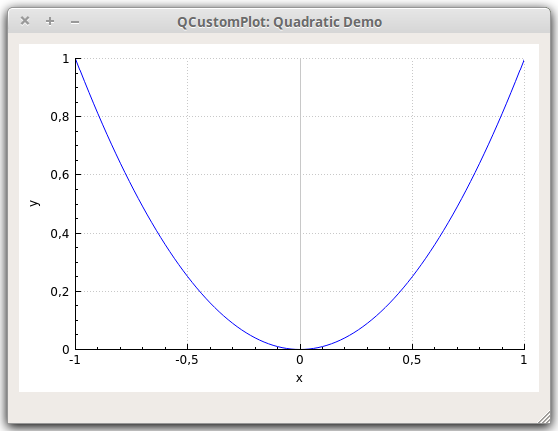
The output should look something like shown below.
The tick step and labeling is chosen automatically, by the axis ticker that is currently used by the axis. This is an instance of type The tick labels (the numbers) of the axes never reach outside the widget border, even when they get wider. This is due to the automatic margin calculation, which is turned on by default. It makes the axis rect shrink if the tick labels and axis labels need more space. If you don't wish that the margin is determined automatically, disable the behaviour by calling Changing the look......of the graphThe look of the graph is characterized by many factors, all of which can be modified. Here are the most important ones:
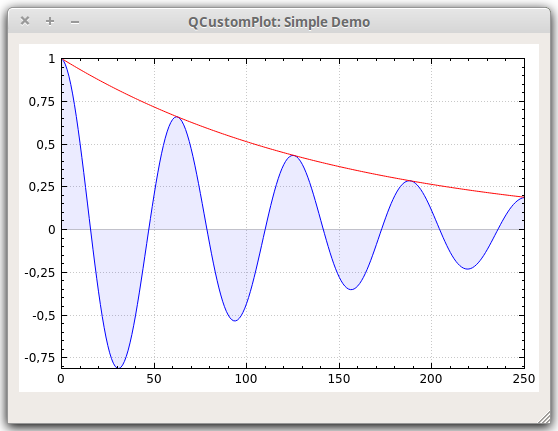
...of the axisThe appearance of the axis can be modified by changing the pens they are painted with and the fonts their labels use. A look at the documentation of QCPAxis should be self-explanatory. Here's a quick summary of the most important properties: ...of the grid linesThe grid is modified by accessing the respective QCPGrid instance of an axis. For example, changing the look of the horizontal grid lines, which are tied to the left axis, is done by accessing ExamplesSimple plot of two graphsHere's an example which creates the image of the decaying cosine function with its exponential envelope:
  // add two new graphs and set their look:
  customPlot->addGraph();
  customPlot->graph(0)->setPen(QPen(Qt::blue)); // line color blue for first graph
  customPlot->graph(0)->setBrush(QBrush(QColor(0, 0, 255, 20))); // first graph will be filled with translucent blue
  customPlot->addGraph();
  customPlot->graph(1)->setPen(QPen(Qt::red)); // line color red for second graph
  // generate some points of data (y0 for first, y1 for second graph):
  QVector<double> x(251), y0(251), y1(251);
  for (int i=0; i<251; ++i)
  {
    x[i] = i;
    y0[i] = qExp(-i/150.0)*qCos(i/10.0); // exponentially decaying cosine
    y1[i] = qExp(-i/150.0);              // exponential envelope
  }
  // configure right and top axis to show ticks but no labels:
  // (see QCPAxisRect::setupFullAxesBox for a quicker method to do this)
  customPlot->xAxis2->setVisible(true);
  customPlot->xAxis2->setTickLabels(false);
  customPlot->yAxis2->setVisible(true);
  customPlot->yAxis2->setTickLabels(false);
  // make left and bottom axes always transfer their ranges to right and top axes:
  connect(customPlot->xAxis, SIGNAL(rangeChanged(QCPRange)), customPlot->xAxis2, SLOT(setRange(QCPRange)));
  connect(customPlot->yAxis, SIGNAL(rangeChanged(QCPRange)), customPlot->yAxis2, SLOT(setRange(QCPRange)));
  // pass data points to graphs:
  customPlot->graph(0)->setData(x, y0);
  customPlot->graph(1)->setData(x, y1);
  // let the ranges scale themselves so graph 0 fits perfectly in the visible area:
  customPlot->graph(0)->rescaleAxes();
  // same thing for graph 1, but only enlarge ranges (in case graph 1 is smaller than graph 0):
  customPlot->graph(1)->rescaleAxes(true);
  // Note: we could have also just called customPlot->rescaleAxes(); instead
  // Allow user to drag axis ranges with mouse, zoom with mouse wheel and select graphs by clicking:
  customPlot->setInteractions(QCP::iRangeDrag | QCP::iRangeZoom | QCP::iSelectPlottables);
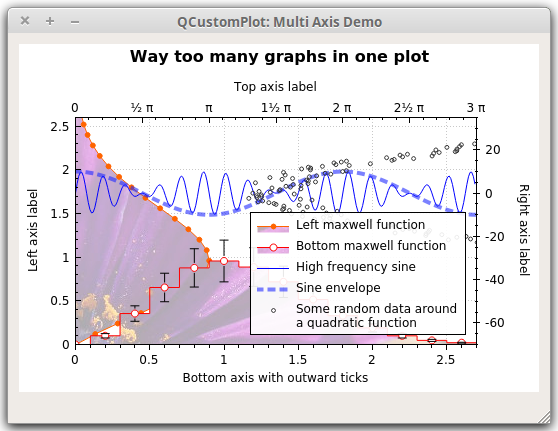
As you can see, applying a fill to a graph is as easy as setting a brush that is not Plotting with multiple axes and more advanced stylingNow, let's look at a more complex example for creating the demo screenshot which contains the five graphs on four axes, textured filling, vertical error bars, a legend, dots as decimal separators etc. customPlot->setLocale(QLocale(QLocale::English, QLocale::UnitedKingdom)); // period as decimal separator and comma as thousand separator
customPlot->legend->setVisible(true);
QFont legendFont = font(); // start out with MainWindow's font..
legendFont.setPointSize(9); // and make a bit smaller for legend
customPlot->legend->setFont(legendFont);
customPlot->legend->setBrush(QBrush(QColor(255,255,255,230)));
// by default, the legend is in the inset layout of the main axis rect. So this is how we access it to change legend placement:
customPlot->axisRect()->insetLayout()->setInsetAlignment(0, Qt::AlignBottom|Qt::AlignRight);
// setup for graph 0: key axis left, value axis bottom
// will contain left maxwell-like function
customPlot->addGraph(customPlot->yAxis, customPlot->xAxis);
customPlot->graph(0)->setPen(QPen(QColor(255, 100, 0)));
customPlot->graph(0)->setBrush(QBrush(QPixmap("./balboa.jpg"))); // fill with texture of specified image
customPlot->graph(0)->setLineStyle(QCPGraph::lsLine);
customPlot->graph(0)->setScatterStyle(QCPScatterStyle(QCPScatterStyle::ssDisc, 5));
customPlot->graph(0)->setName("Left maxwell function");
// setup for graph 1: key axis bottom, value axis left (those are the default axes)
// will contain bottom maxwell-like function with error bars
customPlot->addGraph();
customPlot->graph(1)->setPen(QPen(Qt::red));
customPlot->graph(1)->setBrush(QBrush(QPixmap("./balboa.jpg"))); // same fill as we used for graph 0
customPlot->graph(1)->setLineStyle(QCPGraph::lsStepCenter);
customPlot->graph(1)->setScatterStyle(QCPScatterStyle(QCPScatterStyle::ssCircle, Qt::red, Qt::white, 7));
customPlot->graph(1)->setName("Bottom maxwell function");
QCPErrorBars *errorBars = new QCPErrorBars(customPlot->xAxis, customPlot->yAxis);
errorBars->removeFromLegend();
errorBars->setDataPlottable(customPlot->graph(1));
// setup for graph 2: key axis top, value axis right
// will contain high frequency sine with low frequency beating:
customPlot->addGraph(customPlot->xAxis2, customPlot->yAxis2);
customPlot->graph(2)->setPen(QPen(Qt::blue));
customPlot->graph(2)->setName("High frequency sine");
// setup for graph 3: same axes as graph 2
// will contain low frequency beating envelope of graph 2
customPlot->addGraph(customPlot->xAxis2, customPlot->yAxis2);
QPen blueDotPen;
blueDotPen.setColor(QColor(30, 40, 255, 150));
blueDotPen.setStyle(Qt::DotLine);
blueDotPen.setWidthF(4);
customPlot->graph(3)->setPen(blueDotPen);
customPlot->graph(3)->setName("Sine envelope");
// setup for graph 4: key axis right, value axis top
// will contain parabolically distributed data points with some random perturbance
customPlot->addGraph(customPlot->yAxis2, customPlot->xAxis2);
customPlot->graph(4)->setPen(QColor(50, 50, 50, 255));
customPlot->graph(4)->setLineStyle(QCPGraph::lsNone);
customPlot->graph(4)->setScatterStyle(QCPScatterStyle(QCPScatterStyle::ssCircle, 4));
customPlot->graph(4)->setName("Some random data around\na quadratic function");
// generate data, just playing with numbers, not much to learn here:
QVector<double> x0(25), y0(25);
QVector<double> x1(15), y1(15), y1err(15);
QVector<double> x2(250), y2(250);
QVector<double> x3(250), y3(250);
QVector<double> x4(250), y4(250);
for (int i=0; i<25; ++i) // data for graph 0
{
x0[i] = 3*i/25.0;
y0[i] = qExp(-x0[i]*x0[i]*0.8)*(x0[i]*x0[i]+x0[i]);
}
for (int i=0; i<15; ++i) // data for graph 1
{
x1[i] = 3*i/15.0;;
y1[i] = qExp(-x1[i]*x1[i])*(x1[i]*x1[i])*2.6;
y1err[i] = y1[i]*0.25;
}
for (int i=0; i<250; ++i) // data for graphs 2, 3 and 4
{
x2[i] = i/250.0*3*M_PI;
x3[i] = x2[i];
x4[i] = i/250.0*100-50;
y2[i] = qSin(x2[i]*12)*qCos(x2[i])*10;
y3[i] = qCos(x3[i])*10;
y4[i] = 0.01*x4[i]*x4[i] + 1.5*(rand()/(double)RAND_MAX-0.5) + 1.5*M_PI;
}
// pass data points to graphs:
customPlot->graph(0)->setData(x0, y0);
customPlot->graph(1)->setData(x1, y1);
errorBars->setData(y1err);
customPlot->graph(2)->setData(x2, y2);
customPlot->graph(3)->setData(x3, y3);
customPlot->graph(4)->setData(x4, y4);
// activate top and right axes, which are invisible by default:
customPlot->xAxis2->setVisible(true);
customPlot->yAxis2->setVisible(true);
// set ranges appropriate to show data:
customPlot->xAxis->setRange(0, 2.7);
customPlot->yAxis->setRange(0, 2.6);
customPlot->xAxis2->setRange(0, 3.0*M_PI);
customPlot->yAxis2->setRange(-70, 35);
// set pi ticks on top axis:
customPlot->xAxis2->setTicker(QSharedPointer<QCPAxisTickerPi>(new QCPAxisTickerPi));
// add title layout element:
customPlot->plotLayout()->insertRow(0);
customPlot->plotLayout()->addElement(0, 0, new QCPTextElement(customPlot, "Way too many graphs in one plot", QFont("sans", 12, QFont::Bold)));
// set labels:
customPlot->xAxis->setLabel("Bottom axis with outward ticks");
customPlot->yAxis->setLabel("Left axis label");
customPlot->xAxis2->setLabel("Top axis label");
customPlot->yAxis2->setLabel("Right axis label");
// make ticks on bottom axis go outward:
customPlot->xAxis->setTickLength(0, 5);
customPlot->xAxis->setSubTickLength(0, 3);
// make ticks on right axis go inward and outward:
customPlot->yAxis2->setTickLength(3, 3);
customPlot->yAxis2->setSubTickLength(1, 1);
As you can see, you can define freely which axis should play which role for a graph. Graph with index 0 for example uses the left axis (
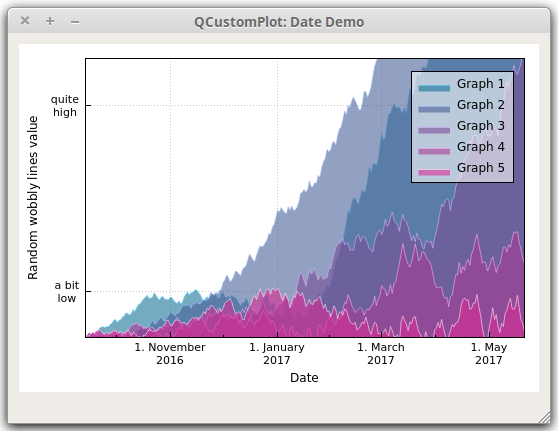
In order to display error bars for graph 1, we've created a Plotting date and time dataNext, we'll look at how to plot date and/or time related data. It basically comes down to installing a different axis ticker of type // set locale to english, so we get english month names:
customPlot->setLocale(QLocale(QLocale::English, QLocale::UnitedKingdom));
// seconds of current time, we'll use it as starting point in time for data:
double now = QDateTime::currentDateTime().toTime_t();
srand(8); // set the random seed, so we always get the same random data
// create multiple graphs:
for (int gi=0; gi<5; ++gi)
{
customPlot->addGraph();
QColor color(20+200/4.0*gi,70*(1.6-gi/4.0), 150, 150);
customPlot->graph()->setLineStyle(QCPGraph::lsLine);
customPlot->graph()->setPen(QPen(color.lighter(200)));
customPlot->graph()->setBrush(QBrush(color));
// generate random walk data:
QVector<QCPGraphData> timeData(250);
for (int i=0; i<250; ++i)
{
timeData[i].key = now + 24*3600*i;
if (i == 0)
timeData[i].value = (i/50.0+1)*(rand()/(double)RAND_MAX-0.5);
else
timeData[i].value = qFabs(timeData[i-1].value)*(1+0.02/4.0*(4-gi)) + (i/50.0+1)*(rand()/(double)RAND_MAX-0.5);
}
customPlot->graph()->data()->set(timeData);
}
// configure bottom axis to show date instead of number:
QSharedPointer<QCPAxisTickerDateTime> dateTicker(new QCPAxisTickerDateTime);
dateTicker->setDateTimeFormat("d. MMMM\nyyyy");
customPlot->xAxis->setTicker(dateTicker);
// configure left axis text labels:
QSharedPointer<QCPAxisTickerText> textTicker(new QCPAxisTickerText);
textTicker->addTick(10, "a bit\nlow");
textTicker->addTick(50, "quite\nhigh");
customPlot->yAxis->setTicker(textTicker);
// set a more compact font size for bottom and left axis tick labels:
customPlot->xAxis->setTickLabelFont(QFont(QFont().family(), 8));
customPlot->yAxis->setTickLabelFont(QFont(QFont().family(), 8));
// set axis labels:
customPlot->xAxis->setLabel("Date");
customPlot->yAxis->setLabel("Random wobbly lines value");
// make top and right axes visible but without ticks and labels:
customPlot->xAxis2->setVisible(true);
customPlot->yAxis2->setVisible(true);
customPlot->xAxis2->setTicks(false);
customPlot->yAxis2->setTicks(false);
customPlot->xAxis2->setTickLabels(false);
customPlot->yAxis2->setTickLabels(false);
// set axis ranges to show all data:
customPlot->xAxis->setRange(now, now+24*3600*249);
customPlot->yAxis->setRange(0, 60);
// show legend with slightly transparent background brush:
customPlot->legend->setVisible(true);
customPlot->legend->setBrush(QColor(255, 255, 255, 150));
The string you pass to
For sub-second accuracy, the axis ticker works with floating point numbers. So values smaller than 1.0 represent the according fraction of a second. You can use Beyond Graphs: Curves, Bar Charts, Statistical Box Plot,...Up to now we've only looked at graphs. Since they are such a dominant use case, QCustomPlot offers a specialized interface for them. We've been using it all the time:
Unlike graphs, other plottables need to be created with Here's a quick example that creates a bar chart with three bars: QCPBars *myBars = new QCPBars(customPlot->xAxis, customPlot->yAxis);
// now we can modify properties of myBars:
myBars->setName("Bars Series 1");
QVector<double> keyData;
QVector<double> valueData;
keyData << 1 << 2 << 3;
valueData << 2 << 4 << 8;
myBars->setData(keyData, valueData);
customPlot->rescaleAxes();
customPlot->replot();
More details about the other plottables can be found in the example project and the other tutorials. Further, each plottable type has a detailed description on the documentation page of the respective class. Of course, it's absolutely possible to write your own plottable to make any data look exactly the way you need it. You should look at the QCPAbstractPlottable documentation for a guide how to start subclassing it. You can also look at the existing plottables to see how they work. For that purpose, It is recommended to have a look at |
| You are visitor 01402503 — GeezerVison does not store the pages you look up. Best viewed with Netscape Navigator 4.7 or Internet Explorer 6 at 800×600. No cookies required. |