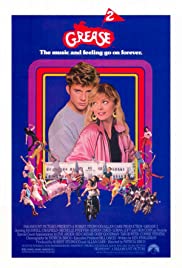
GeezerVison is showing www.the-numbers.com — Grease 2 (1982) - Box Office and Financial Information
Grease 2 (1982)
Metrics
| Opening Weekend: | $4,645,411 (32.5% of total gross) |
| Legs: | 3.08 (domestic box office/biggest weekend) |
| Domestic Share: | 100.0% (domestic box office/worldwide) |
| Theater counts: | 1,250 opening theaters/1,250 max. theaters, 4.1 weeks average run per theater |
| Infl. Adj. Dom. BO |
$54,999,998 |
Movie Details
| Domestic Releases: |
June 11th, 1982 (Wide) by Paramount Pictures |
| Video Release: |
June 10th, 2003 by Warner Home Video |
| MPA Rating: |
PG |
| Running Time: |
115 minutes |
| Franchise: |
Grease |
| Plot point: |
Romance | | Social setting: |
High School | | Subgenre: |
Romantic Musical | | Time period setting: |
1960s |
| Source: | Based on Musical or Opera |
| Genre: | Musical |
| Production Method: | Live Action |
| Creative Type: | Historical Fiction |
| Production Countries: |
United States |
| Languages: |
English |
Weekend Box Office Performance
| Date | Rank | Gross | % Change | Theaters | Per Theater | Total Gross | Week |
|---|
| Jun 11, 1982 |
5 |
$4,645,411 |
|
1,250 |
$3,716 |
$4,645,411 |
1 |
| Jun 18, 1982 |
8 |
$2,261,750 |
-51% |
1,250 |
$1,809 |
$9,035,874 |
2 |
| Jun 25, 1982 |
14 |
$1,012,382 |
-55% |
825 |
$1,227 |
$11,045,234 |
3 |
| Jul 2, 1982 |
14 |
$701,036 |
-31% |
650 |
$1,079 |
$12,309,441 |
4 |
| Jul 9, 1982 |
14 |
$540,621 |
-23% |
504 |
$1,073 |
$13,202,650 |
5 |
| Jul 16, 1982 |
20 |
$375,043 |
-31% |
380 |
$987 |
$13,770,814 |
6 |
| Jul 23, 1982 |
24 |
$302,164 |
-19% |
300 |
$1,007 |
$14,297,083 |
7 |
Weekly Box Office Performance
| Date | Rank | Gross | % Change | Theaters | Per Theater | Total Gross | Week |
|---|
| Jun 11, 1982 |
5 |
$6,774,124 |
|
1,250 |
$5,419 |
$6,774,124 |
1 |
| Jun 18, 1982 |
8 |
$3,258,728 |
-52% |
1,250 |
$2,607 |
$10,032,852 |
2 |
| Jun 25, 1982 |
13 |
$1,575,553 |
-52% |
825 |
$1,910 |
$11,608,405 |
3 |
| Jul 2, 1982 |
12 |
$1,053,624 |
-33% |
650 |
$1,621 |
$12,662,029 |
4 |
| Jul 9, 1982 |
14 |
$733,742 |
-30% |
504 |
$1,456 |
$13,395,771 |
5 |
| Jul 16, 1982 |
19 |
$599,148 |
-18% |
380 |
$1,577 |
$13,994,919 |
6 |
Leading
| Michelle Pfeiffer |
|
Stephanie Zinone |
| Andy Tennant |
|
Boy Greaser |
| Sid Caesar |
|
Coach Calhoun |
| Maxwell Caulfield |
|
Michael Carrington |
| Christopher McDonald |
|
Goose McKenzie |
Production and Technical Credits
| Patricia Birch |
|
Director |
| Ken Finkleman |
|
Screenwriter |
| Jim Jacobs |
|
Story Creator |
| Warren Casey |
|
Story Creator |
Cast and crew with above-the-line roles are marked in bold. The line marks the division between above-the-line and below-the-line roles.
Metrics
| Opening Weekend: | $4,645,411 (32.5% of total gross) |
| Legs: | 3.08 (domestic box office/biggest weekend) |
| Domestic Share: | 100.0% (domestic box office/worldwide) |
| Theater counts: | 1,250 opening theaters/1,250 max. theaters, 4.1 weeks average run per theater |
| Infl. Adj. Dom. BO |
$54,999,998 |
Movie Details
| Domestic Releases: |
June 11th, 1982 (Wide) by Paramount Pictures |
| Video Release: |
June 10th, 2003 by Warner Home Video |
| MPA Rating: |
PG |
| Running Time: |
115 minutes |
| Franchise: |
Grease |
| Plot point: |
Romance | | Social setting: |
High School | | Subgenre: |
Romantic Musical | | Time period setting: |
1960s |
| Source: | Based on Musical or Opera |
| Genre: | Musical |
| Production Method: | Live Action |
| Creative Type: | Historical Fiction |
| Production Countries: |
United States |
| Languages: |
English |
Weekend Box Office Performance
| Date | Rank | Gross | % Change | Theaters | Per Theater | Total Gross | Week |
|---|
| Jun 11, 1982 |
5 |
$4,645,411 |
|
1,250 |
$3,716 |
$4,645,411 |
1 |
| Jun 18, 1982 |
8 |
$2,261,750 |
-51% |
1,250 |
$1,809 |
$9,035,874 |
2 |
| Jun 25, 1982 |
14 |
$1,012,382 |
-55% |
825 |
$1,227 |
$11,045,234 |
3 |
| Jul 2, 1982 |
14 |
$701,036 |
-31% |
650 |
$1,079 |
$12,309,441 |
4 |
| Jul 9, 1982 |
14 |
$540,621 |
-23% |
504 |
$1,073 |
$13,202,650 |
5 |
| Jul 16, 1982 |
20 |
$375,043 |
-31% |
380 |
$987 |
$13,770,814 |
6 |
| Jul 23, 1982 |
24 |
$302,164 |
-19% |
300 |
$1,007 |
$14,297,083 |
7 |
Weekly Box Office Performance
| Date | Rank | Gross | % Change | Theaters | Per Theater | Total Gross | Week |
|---|
| Jun 11, 1982 |
5 |
$6,774,124 |
|
1,250 |
$5,419 |
$6,774,124 |
1 |
| Jun 18, 1982 |
8 |
$3,258,728 |
-52% |
1,250 |
$2,607 |
$10,032,852 |
2 |
| Jun 25, 1982 |
13 |
$1,575,553 |
-52% |
825 |
$1,910 |
$11,608,405 |
3 |
| Jul 2, 1982 |
12 |
$1,053,624 |
-33% |
650 |
$1,621 |
$12,662,029 |
4 |
| Jul 9, 1982 |
14 |
$733,742 |
-30% |
504 |
$1,456 |
$13,395,771 |
5 |
| Jul 16, 1982 |
19 |
$599,148 |
-18% |
380 |
$1,577 |
$13,994,919 |
6 |
Leading
| Michelle Pfeiffer |
|
Stephanie Zinone |
| Andy Tennant |
|
Boy Greaser |
| Sid Caesar |
|
Coach Calhoun |
| Maxwell Caulfield |
|
Michael Carrington |
| Christopher McDonald |
|
Goose McKenzie |
Production and Technical Credits
| Patricia Birch |
|
Director |
| Ken Finkleman |
|
Screenwriter |
| Jim Jacobs |
|
Story Creator |
| Warren Casey |
|
Story Creator |
Cast and crew with above-the-line roles are marked in bold. The line marks the division between above-the-line and below-the-line roles.
|