GeezerVisonThe World Wide Web, restored to 800 pixels of glory. |
| Home|About|Gaming cabinet|Archives|How it works|Starter sites |
GeezerVison is showing www.tutorialspoint.com — Python Pandas - Density Plot 
Selected Reading
Python Pandas - Density PlotA Density Plot, also known as a Kernel Density Estimate (KDE) plot, is a non-parametric way to estimate the Probability Density Function (PDF) of a random variable. It is commonly used to visualize the distribution of data. It is closely related to histograms, instead of using bars to represent data distribution, density plot creates a smooth curve that estimates the Probability Density Function (PDF) of a dataset by applying Gaussian kernels to smooth the data points. In this tutorial, we will learn about creating and customizing density plots using Pandas library with different examples. Density Plot in PandasIn Pandas, you can easily create Density Plots using the plot.kde() or plot.density() methods available for both Series and DataFrame objects. These methods internally use Matplotlib and return either a matplotlib.axes.Axes object or NumPy array np.ndarray of Axes. SyntaxFollowing is the syntax of the plot.kde() or plot.density() method − plot.kde(bw_method=None, ind=None, **kwargs) Where,
Density Plots for SeriesFor creating a density plot for a single Pandas Series object, you can use the series.plot.kde() or plot.density() methods. ExampleHere's an example of how to create a simple density plot for a Pandas Series object. This plot visualizes the data distribution as a smooth curve. import pandas as pd
import matplotlib.pyplot as plt
plt.rcParams["figure.figsize"] = [7, 4]
# Sample data
series = pd.Series([1, 2, 2.5, 3, 3.5, 4, 5])
# Create density plot
densityplot = series.plot.kde()
# Set the title and display the plot
plt.title("Simple Density Plot")
plt.show()
OutputFollowing is the output of the above code − 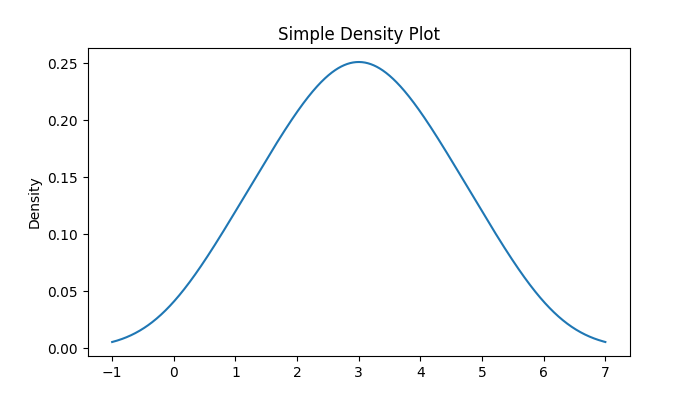
Density Plots for DataFrameYou can also create a density plot for an entire DataFrame or specific columns of the DataFrame by using the DataFrame.plot.kde() or DataFrame.plot.density() methods. ExampleThe following example demonstrates how to generate a density plot for a specific attribute of a DataFrame. import pandas as pd
import matplotlib.pyplot as plt
import numpy as np
plt.rcParams["figure.figsize"] = [7, 4]
# Generate random data
df = pd.DataFrame(np.random.normal(size=(10, 4)), columns=["Col1", "Col2", "Col3", "Col4"])
# Create density plot for a specific attribute of a DataFrame
df.Col1.plot.kde()
# Set the title and display the plot
plt.title("Density Plot for a DataFrame column")
plt.show()
OutputOn executing the above code we will get the following output − 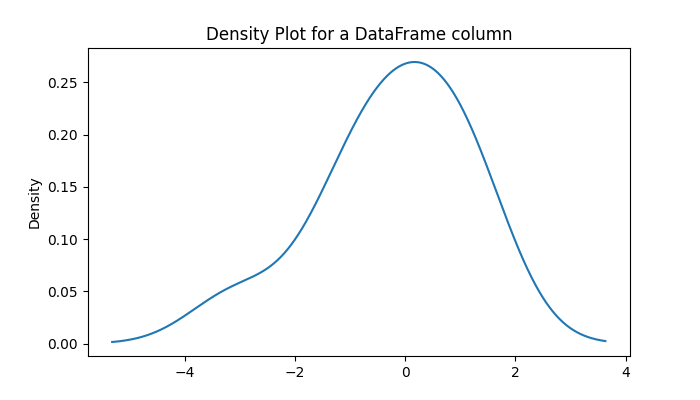
Multiple Density Plots on the Same AxesYou can overlay multiple density plots on the same axes. Which is useful for comparing the distributions of multiple columns. ExampleThe following example demonstrates creating a multiple density plots on the same axes using the DataFrame.plot.kde() method. import pandas as pd
import numpy as np
import matplotlib.pyplot as plt
plt.rcParams["figure.figsize"] = [7, 4]
# Create a DataFrame
df = pd.DataFrame(np.random.normal(size=(100, 4)), columns=["Col1", "Col2", "Col3", "Col4"])
# Plot density plots
ax = df.plot.kde()
# Set the title and display the plot
plt.title("Multiple Density Plots")
plt.show()
OutputFollowing is the output of the above code − 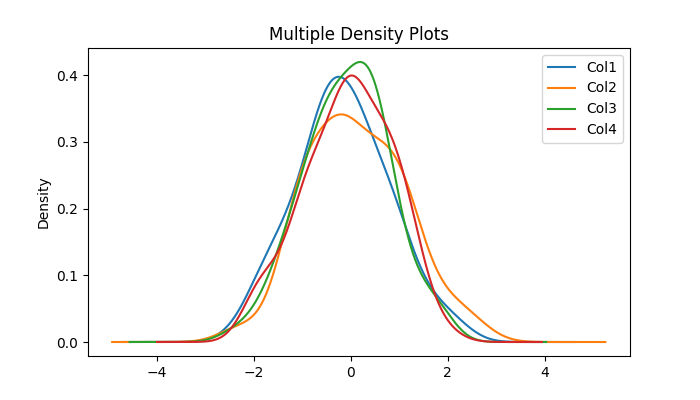
Adjusting Bandwidth of the Density PlotThe bw_method parameter controls the smoothness of the density plot. Smaller values may lead to over-fitting, while larger values result in under-fit the data. Example: Density plot for Small BandwidthThis example uses the bw_method parameter to adjust the bandwidth of the density plot for small bandwidth. import pandas as pd
import numpy as np
import matplotlib.pyplot as plt
plt.rcParams["figure.figsize"] = [7, 4]
# Create a DataFrame
df = pd.DataFrame(np.random.normal(size=(100, 4)), columns=["Col1", "Col2", "Col3", "Col4"])
# Small bandwidth
df.plot.kde(bw_method=0.3)
plt.title("Density Plot with Small Bandwidth (DataFrame)")
plt.show()
OutputFollowing is the output of the above code − 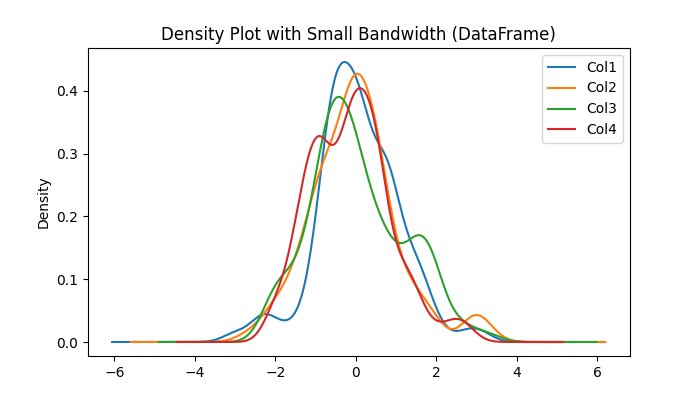
Example: Density plot for Large BandwidthThis example uses the bw_method parameter to adjust the bandwidth of the density plot for large bandwidth. import pandas as pd
import numpy as np
import matplotlib.pyplot as plt
plt.rcParams["figure.figsize"] = [7, 4]
# Create a DataFrame
df = pd.DataFrame(np.random.normal(size=(100, 4)), columns=["Col1", "Col2", "Col3", "Col4"])
# Large bandwidth
df.plot.kde(bw_method=3)
plt.title("Density Plot with Large Bandwidth (DataFrame)")
plt.show()
OutputFollowing is the output of the above code − 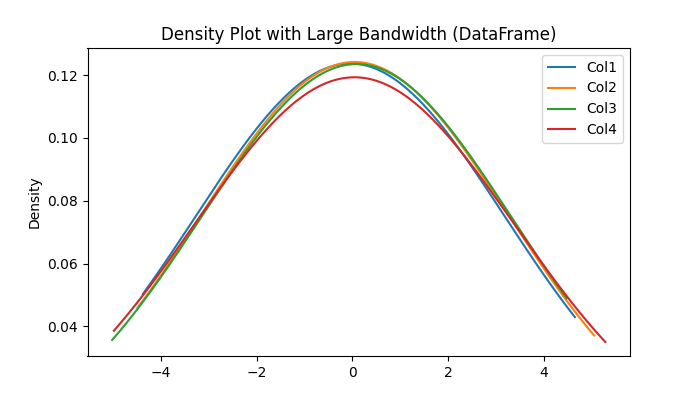
Customizing Evaluation PointsTo customize the evaluation point, you can use the ind parameter. This allows you to control the specific points at which the KDE is calculated. ExampleThe following example demonstrates customizing the evaluation points of the density plot by using the ind parameter of the plot.kde() method. import pandas as pd
import numpy as np
import matplotlib.pyplot as plt
plt.rcParams["figure.figsize"] = [7, 4]
# Generate random data
df = pd.DataFrame(np.random.normal(size=(10, 4)), columns=["Col1", "Col2", "Col3", "Col4"])
# Create density plot
df.plot.kde(ind=[-2, -1, 0, 1, 2, 3])
plt.title("Density Plot with Custom Evaluation Points (DataFrame)")
plt.show()
OutputOn executing the above code we will get the following output − 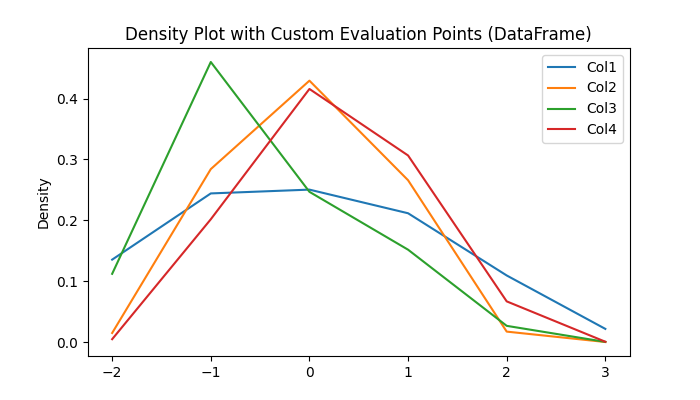
python_pandas_visualization.htm 
Advertisements
|
| You are visitor 01402503 — GeezerVison does not store the pages you look up. Best viewed with Netscape Navigator 4.7 or Internet Explorer 6 at 800×600. No cookies required. |