GeezerVisonThe World Wide Web, restored to 800 pixels of glory. | ||||||||||||||||||||||||||||||||||||||||||||
| Home|About|Gaming cabinet|Archives|How it works|Starter sites | ||||||||||||||||||||||||||||||||||||||||||||
GeezerVison is showing www.tutorialspoint.com — Python Pandas - Visualization 
Selected Reading
Python Pandas - VisualizationVisualization of data plays an important role in data analysis, it helps you represent the data graphically for better understanding, and identifying the patterns. However, Pandas library is primarily used for data manipulation and analysis but it also provides the data visualization capabilities by using the Python's Matplotlib library support. In Python, the Pandas library provides a basic method called .plot() for generating a wide variety of visualizations along the different specialized plotting methods. These visualizations tools are built on top of the Python's Matplotlib library, offering flexibility and customization options. Behind the scenes, every plot generated by Pandas is actually a Matplotlib object. This integration allows users to leverage Matplotlib's extensive customization options for fine-tuning Pandas-generated plots. In this tutorial, we will learn about basics of visualizing data using the Pandas data structures. Setting Up the Environment for VisualizationBefore learning about Pandas data Visualization, we should ensure that Matplotlib library is installed. Following is the command for installing the Matplotlib library − pip install pandas matplotlib Importing LibrariesAlong with the import pandas as pd you need to import the Matplotlib's functional interface for displaying, customizing, and saving plots using the following command − import matplotlib.pyplot as plt Displaying the plotsIn environments like Jupyter Notebook or IPython shell, plots are often displayed automatically as they are generated. However, in a standard Python script or shell, this does not happen automatically. To explicitly display a plot in such environments, we need to call the following command − plt.show() This command renders the Matplotlib figure object in a GUI window. Pandas Basic Plotting MethodThe Pandas library provides a basic plotting method called plot() on both the Series and DataFrame objects for plotting different kind plots. This method is a simple wrapper around the matplotlib plt.plot() method. SyntaxFollowing is the syntax of the Pandas .plot() method − DataFrame.plot(*args, **kwargs) Where,
ExampleHere is the following example of plotting a random DataFrame data using the Pandas plot() method. import pandas as pd
import numpy as np
import matplotlib.pyplot as plt
# Creating a random DataFrame
df = pd.DataFrame(np.random.randn(10,4),index=pd.date_range('1/1/2000',
periods=10), columns=list('ABCD'))
# Plotting the DataFrame
df.plot()
plt.show()
OutputIts output is as follows − 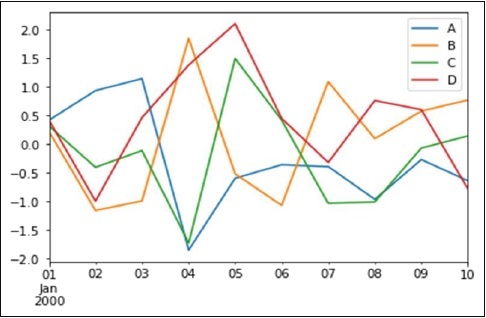
If the index consists of dates, then the pandas .plot() method calls the Matplotlib gct().autofmt_xdate() to format the x-axis labels. Also we can plot one column versus another using the x and y keywords. Types of Plots Available in PandasPandas supports various plot types through the kind parameter or specialized plotting methods. Following is the overview of the different plotting methods −
Example: Plotting Bar Plot with plot() methodLet us now see what a Bar Plot is by creating one. A bar plot can be created in the following way − import pandas as pd import numpy as np import matplotlib.pyplot as plt # Creating a random DataFrame df = pd.DataFrame(np.random.rand(10,4), columns=['a','b','c','d']) # Plotting the bar plot df.plot(kind='bar') plt.show() OutputIts output is as follows − 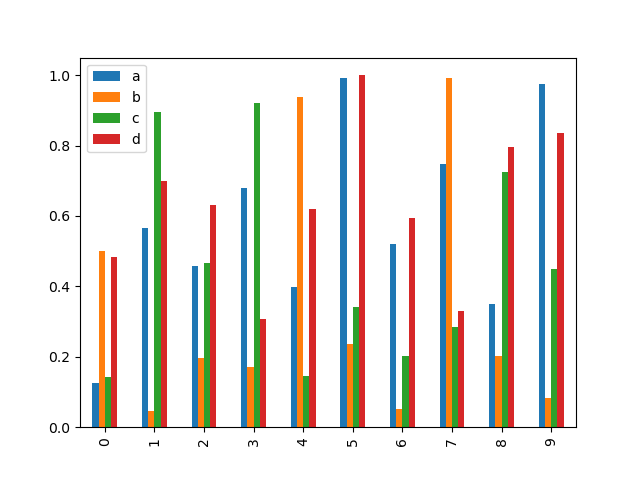
To produce a stacked bar plot, pass stacked=True − import pandas as pd import numpy as np import matplotlib.pyplot as plt # Creating a random DataFrame df = pd.DataFrame(np.random.rand(10,4), columns=['a','b','c','d']) # Plotting the stacked Bar plot df.plot(kind='bar', stacked=True) plt.show() OutputIts output is as follows − 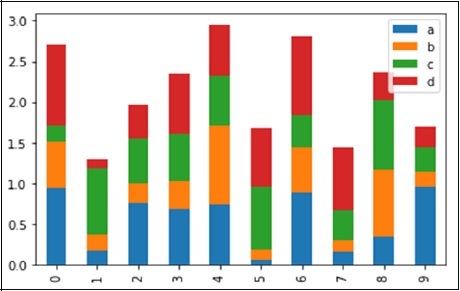
To get horizontal bar plots, use the barh option − import pandas as pd import numpy as np import matplotlib.pyplot as plt # Creating a random DataFrame df = pd.DataFrame(np.random.rand(10,4), columns=['a','b','c','d']) # Plotting the horizontal bar plot df.plot(kind='barh', stacked=True) plt.show() OutputIts output is as follows − 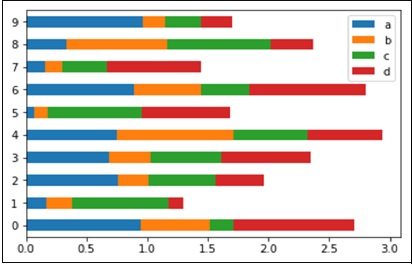
HistogramsHistograms can be plotted using the hist option of the plot() method kind argument. We can specify number of bins. import pandas as pd
import numpy as np
import matplotlib.pyplot as plt
# Creating a random DataFrame
df = pd.DataFrame({'a':np.random.randn(1000)+1,'b':np.random.randn(1000),
'c':np.random.randn(1000) - 1}, columns=['a', 'b', 'c'])
df.plot(kind='hist', bins=20)
plt.show()
OutputIts output is as follows − 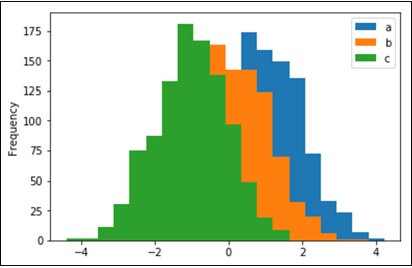
Box PlotsBox plot can be drawn calling 'box' option for both the Series and DataFrame objects to visualize the distribution of values within each column. For instance, here is a boxplot representing five trials of 10 observations of a uniform random variable on [0,1). import pandas as pd import numpy as np import matplotlib.pyplot as plt # Creating a random DataFrame df = pd.DataFrame(np.random.rand(10, 5), columns=['A', 'B', 'C', 'D', 'E']) df.plot(kind='box') plt.show() OutputIts output is as follows − 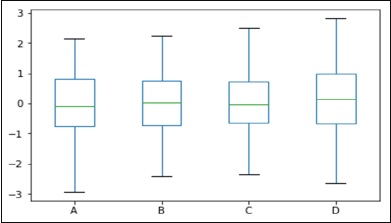
Area PlotArea plot can be created using the plot(kind='area') option. import pandas as pd import numpy as np import matplotlib.pyplot as plt # Creating a random DataFrame df = pd.DataFrame(np.random.rand(10, 4), columns=['a', 'b', 'c', 'd']) df.plot(kind='area') plt.show() OutputIts output is as follows − 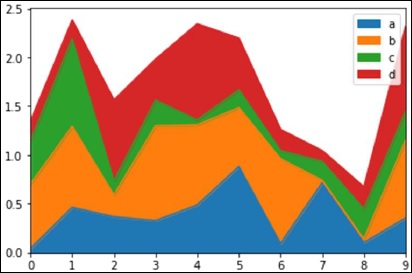
Scatter PlotScatter plot can be created using the plot(kind='scatter') option. import pandas as pd import numpy as np import matplotlib.pyplot as plt # Creating a random DataFrame df = pd.DataFrame(np.random.rand(50, 4), columns=['a', 'b', 'c', 'd']) df.plot(kind='scatter', x='a', y='b') plt.show() OutputIts output is as follows − 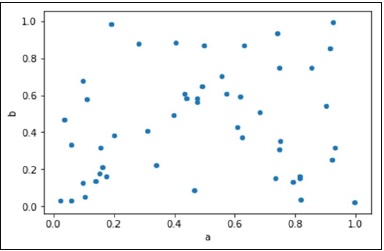
Pie ChartPie chart can be created using the plot(kind='pie') option. import pandas as pd import numpy as np import matplotlib.pyplot as plt # Creating a random DataFrame df = pd.DataFrame(3 * np.random.rand(4), index=['a', 'b', 'c', 'd'], columns=['x']) df.plot(kind='pie', subplots=True) plt.show() OutputIts output is as follows − 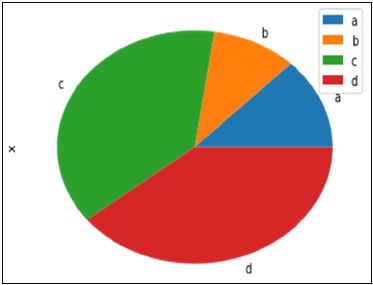 
Advertisements
| ||||||||||||||||||||||||||||||||||||||||||||
| You are visitor 01402503 — GeezerVison does not store the pages you look up. Best viewed with Netscape Navigator 4.7 or Internet Explorer 6 at 800×600. No cookies required. |