GeezerVisonThe World Wide Web, restored to 800 pixels of glory. |
| Home|About|Gaming cabinet|Archives|How it works|Starter sites |
GeezerVison is showing www.tutorialspoint.com — Python Pandas - Line Plot 
Selected Reading
Python Pandas - Line PlotA line plot is a visual representation of data where individual points are connected by straight lines. It is mainly used to observe relationships between two variables on x-axis and y-axis. This plot helps you to visualize fluctuations, patterns, trends, or progressions in your data. For instance, let us create a graph where you have the student attendance over a specific period, such as months or semesters. The x-axis will represent the months, and the y-axis will represent the attendance in percent sign − 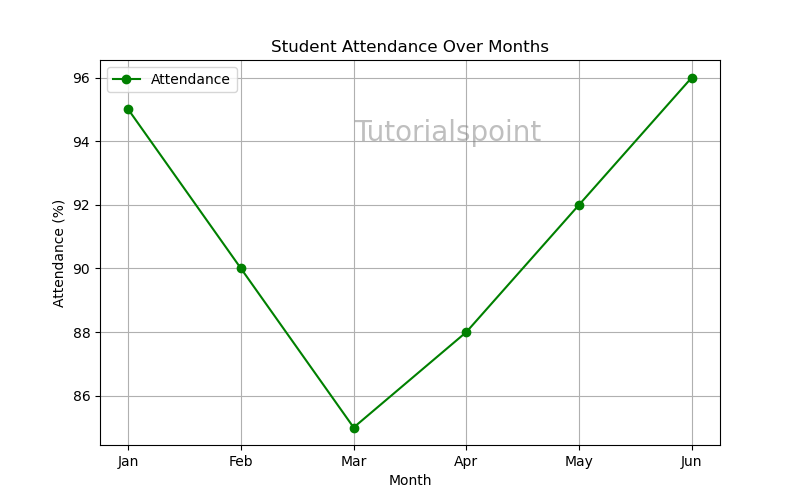
In this tutorial, we will learn how to create and customize line plots using the Pandas library in Python. Line Plot in PandasPandas provides the plot.line() method to create line plots from Series and DataFrames. This method internally uses Matplotlib and returns a matplotlib.axes.Axes object or an NumPy array np.ndarray of Axes when subplots parameter is set to True.
SyntaxThe following is the syntax of the plot.line() method for both the Series and DataFrames objects − DataFrame.plot.line(x=None, y=None, **kwargs) Parameters,
Example: Creating Line Plot for Series DataThis example demonstrates using the Series.plot.line() method on a Pandas Series object. import pandas as pd
import numpy as np
import matplotlib.pyplot as plt
# Create a Pandas Series
series = pd.Series(3 * np.random.rand(4), index=["a", "b", "c", "d"])
# Generate a line plot
series.plot.line(figsize=(7, 4))
# Set title and Display the plot
plt.title('Basic line Plot')
plt.show()
OutputFollowing is the output of the above code − 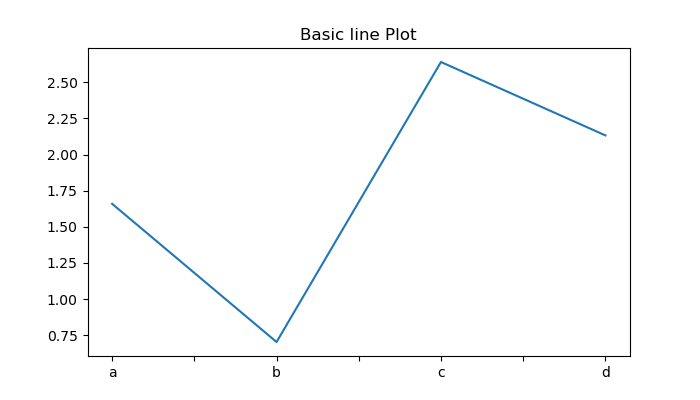
Example: Creating Line Plot for a DataFrameThis example demonstrates how to create a line plot for multiple columns in a DataFrame using the DataFrame.plot.line() method. import pandas as pd
import matplotlib.pyplot as plt
# Create a DataFrame with population data
df = pd.DataFrame({
'Pig': [20, 18, 489, 675, 1776],
'Horse': [4, 25, 281, 600, 1900]
}, index=[1990, 1997, 2003, 2009, 2014])
# Generate a line plot
df.plot.line()
# Show the plot
plt.title('Animal Population Over Time')
plt.xlabel('Year')
plt.ylabel('Population')
plt.show()
OutputAfter executing the above code, we get the following output − 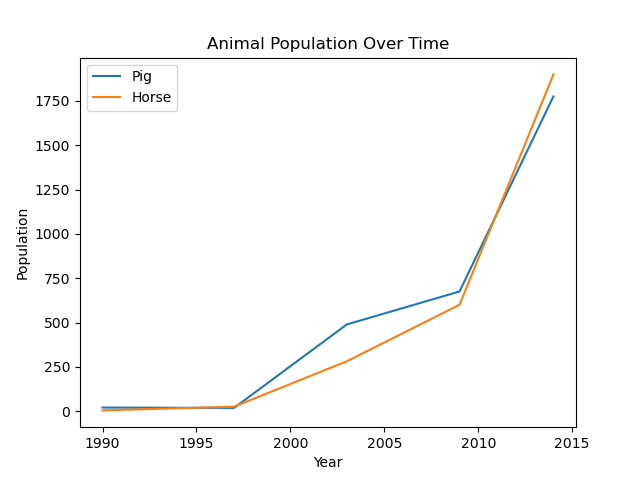
Customizing a Line PlotPandas allows customization of line plots through various parameters such as, labels, colors, autopct, fontsize, and more. ExampleThis example demonstrates customizing the line plot using the addition keyword arguments. Here we will create the separate subplots by setting the subplots=True and specified the different colors for each column using the color parameter. import pandas as pd
import matplotlib.pyplot as plt
# Create a DataFrame with population data
df = pd.DataFrame({
'Pig': [20, 18, 489, 675, 1776],
'Horse': [4, 25, 281, 600, 1900]
}, index=[1990, 1997, 2003, 2009, 2014])
# Customizing line colors
df.plot.line(subplots=True, color={"Pig": "pink", "Horse": "brown"})
# Show the plot
plt.title('Animal Population Over Time')
plt.xlabel('Year')
plt.ylabel('Population')
plt.show()
OutputFollowing is the output of the above code − 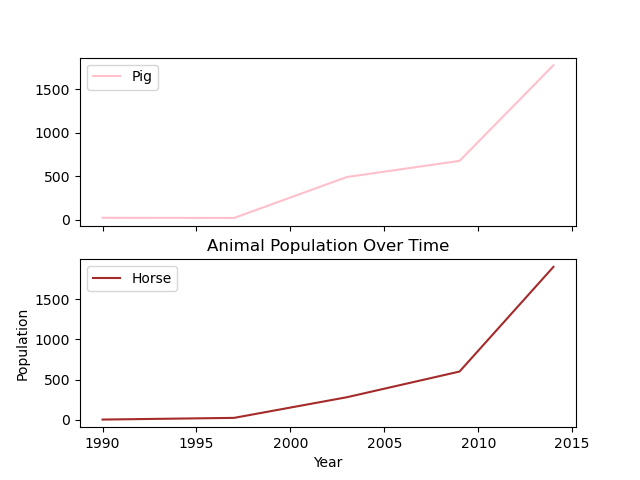
Line Plot One Column Against AnotherPandas plot.line() method easily draw line plot one column against another column by specifying. ExampleThis example demonstrates how to plot one column against another using the plot.line() method. import pandas as pd
import matplotlib.pyplot as plt
# Create a DataFrame with population data
df = pd.DataFrame({
'Pig': [20, 18, 489, 675, 1776],
'Horse': [4, 25, 281, 600, 1900]
}, index=[1990, 1997, 2003, 2009, 2014])
# Plotting Horse population against Pig population
df.plot.line(x='Pig', y='Horse')
# Show the plot
plt.title('Horse Population vs Pig Population')
plt.xlabel('Pig Population')
plt.ylabel('Horse Population')
plt.show()
OutputOn executing the above code we will get the following output − 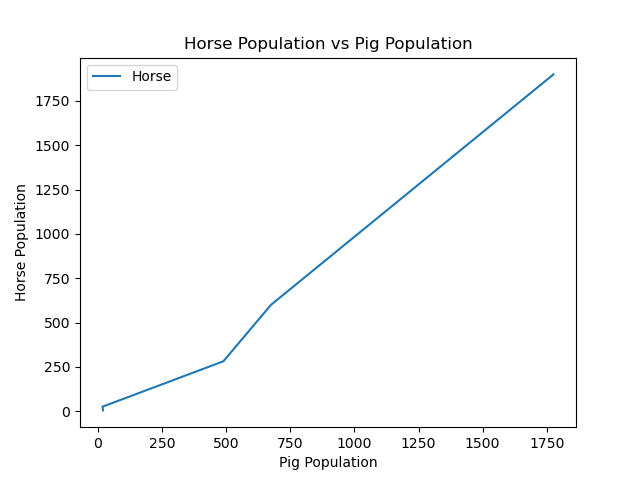
python_pandas_visualization.htm 
Advertisements
|
| You are visitor 01402503 — GeezerVison does not store the pages you look up. Best viewed with Netscape Navigator 4.7 or Internet Explorer 6 at 800×600. No cookies required. |