GV

GeezerVison

The World Wide Web, restored to 800 pixels of glory.

Home|About|Gaming cabinet|Archives|How it works|Starter sites

On this site

  • Python Technologies
  • Databases
  • Computer Programming
  • Web Development
  • Java Technologies
  • Computer Science
  • Mobile Development
  • Big Data & Analytics
  • Microsoft Technologies
  • DevOps
  • Latest Technologies
  • Machine Learning
  • Digital Marketing
  • Software Quality

This view

  • Original page
  • New address

GeezerVison is showing www.tutorialspoint.com — Python Pandas - Pie Plot

Python Pandas Tutorial
  • Python Pandas - Home
  • Python Pandas - Introduction
  • Python Pandas - Environment Setup
  • Python Pandas - Basics
  • Python Pandas - Introduction to Data Structures
  • Python Pandas - Index Objects
  • Python Pandas - Panel
  • Python Pandas - Basic Functionality
  • Python Pandas - Indexing & Selecting Data
  • Python Pandas - Series
  • Python Pandas - Series
  • Python Pandas - Slicing a Series Object
  • Python Pandas - Attributes of a Series Object
  • Python Pandas - Arithmetic Operations on Series Object
  • Python Pandas - Converting Series to Other Objects
  • Python Pandas - DataFrame
  • Python Pandas - DataFrame
  • Python Pandas - Accessing DataFrame
  • Python Pandas - Slicing a DataFrame Object
  • Python Pandas - Modifying DataFrame
  • Python Pandas - Removing Rows from a DataFrame
  • Python Pandas - Arithmetic Operations on DataFrame
  • Python Pandas - IO Tools
  • Python Pandas - IO Tools
  • Python Pandas - Working with CSV Format
  • Python Pandas - Reading & Writing JSON Files
  • Python Pandas - Reading Data from an Excel File
  • Python Pandas - Writing Data to Excel Files
  • Python Pandas - Working with HTML Data
  • Python Pandas - Clipboard
  • Python Pandas - Working with HDF5 Format
  • Python Pandas - Comparison with SQL
  • Python Pandas - Data Handling
  • Python Pandas - Sorting
  • Python Pandas - Reindexing
  • Python Pandas - Iteration
  • Python Pandas - Concatenation
  • Python Pandas - Statistical Functions
  • Python Pandas - Descriptive Statistics
  • Python Pandas - Working with Text Data
  • Python Pandas - Function Application
  • Python Pandas - Options & Customization
  • Python Pandas - Window Functions
  • Python Pandas - Aggregations
  • Python Pandas - Merging/Joining
  • Python Pandas - MultiIndex
  • Python Pandas - Basics of MultiIndex
  • Python Pandas - Indexing with MultiIndex
  • Python Pandas - Advanced Reindexing with MultiIndex
  • Python Pandas - Renaming MultiIndex Labels
  • Python Pandas - Sorting a MultiIndex
  • Python Pandas - Binary Operations
  • Python Pandas - Binary Comparison Operations
  • Python Pandas - Boolean Indexing
  • Python Pandas - Boolean Masking
  • Python Pandas - Data Reshaping & Pivoting
  • Python Pandas - Pivoting
  • Python Pandas - Stacking & Unstacking
  • Python Pandas - Melting
  • Python Pandas - Computing Dummy Variables
  • Python Pandas - Categorical Data
  • Python Pandas - Categorical Data
  • Python Pandas - Ordering & Sorting Categorical Data
  • Python Pandas - Comparing Categorical Data
  • Python Pandas - Handling Missing Data
  • Python Pandas - Missing Data
  • Python Pandas - Filling Missing Data
  • Python Pandas - Interpolation of Missing Values
  • Python Pandas - Dropping Missing Data
  • Python Pandas - Calculations with Missing Data
  • Python Pandas - Handling Duplicates
  • Python Pandas - Duplicated Data
  • Python Pandas - Counting & Retrieving Unique Elements
  • Python Pandas - Duplicated Labels
  • Python Pandas - Grouping & Aggregation
  • Python Pandas - GroupBy
  • Python Pandas - Time-series Data
  • Python Pandas - Date Functionality
  • Python Pandas - Timedelta
  • Python Pandas - Sparse Data Structures
  • Python Pandas - Sparse Data
  • Python Pandas - Visualization
  • Python Pandas - Visualization
  • Python Pandas - Additional Concepts
  • Python Pandas - Caveats & Gotchas
  • Python Pandas Useful Resources
  • Python Pandas - Quick Guide
  • Python Pandas - Cheatsheet
  • Python Pandas - Useful Resources
  • Python Pandas - Discussion
Selected Reading
  • UPSC IAS Exams Notes
  • Developer's Best Practices
  • Questions and Answers
  • Online Resume Builder
  • HR Interview Questions
  • Computer Glossary
  • Who is Who

Python Pandas - Pie Plot


Previous
Quiz
Next

A pie plot is a circular chart that shows data as slices, with each slice representing a portion of the dataset. It is useful for visualizing the relative sizes of different data values. In a pie chart, the size of each slice, including its angle, area, and arc length, corresponds to the value or percentage it represents. The total of all percentages equals 100%, and the sum of all slice angles is 360.

For instance, consider a dataset that records the pass percentages of boys and girls in a classroom. A pie plot visually represents this data, where each slice indicates the proportion of boys and girls passing.
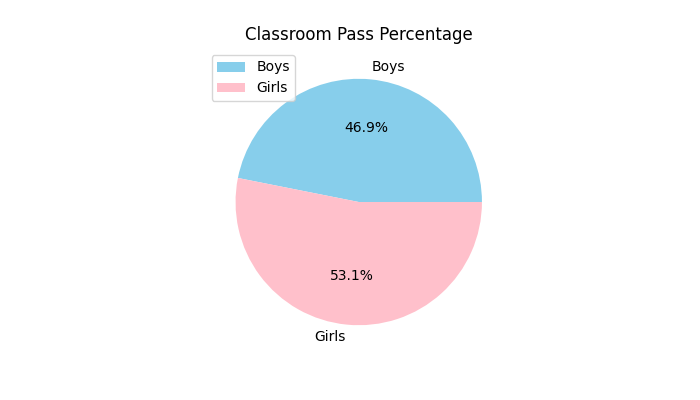
Pie Plot Introduction

In this tutorial, we will learn how to create and customize pie plots in Python using the Pandas library.

Pie Plot in Pandas

In Pandas, pie plot can be created using the plot.pie() method for both the Series and DataFrames objects. This method internally use Matplotlib and return either a matplotlib.axes.Axes object or NumPy array np.ndarray of Axes when subplots parameter is set to True.

  • DataFrame.plot.pie(): Creates pie plot for one or more columns in a DataFrame.

  • Series.plot.pie(): Creates a pie plot for a specific column or Series.

Syntax

Following is the syntax of the plot.pie() method for both the Series and DataFrames objects −

Series.plot.pie(**kwargs)

Where,

  • y: Specify the column label or position to plot. Required when using DataFrame.plot.pie() without subplots=True.

  • **kwargs: Additional keyword arguments to customize the plot appearance.

Example: Creating Pie Plot for Series Data

This example demonstrates using the Series.plot.pie() method on a pandas Series object to generate the pie plot.

import pandas as pd
import numpy as np
import matplotlib.pyplot as plt

# Create a Pandas Series
series = pd.Series(3 * np.random.rand(4), index=["a", "b", "c", "d"])

# Generate a pie plot
series.plot.pie(figsize=(7, 4))

# Set title and Display the plot
plt.title('Basic Pie Plot')
plt.show()

Output

Following is the output of the above code −
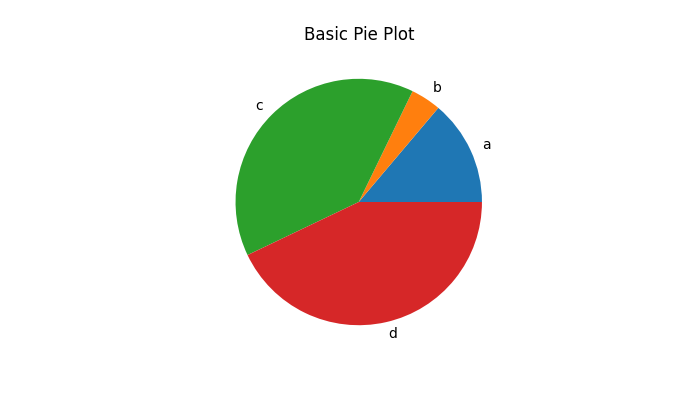
Basic Pie Plot

Example: Creating Pie Plot for a DataFrame

This example uses the DataFrame.plot.pie() method for the creating the pie plot.

import pandas as pd
import matplotlib.pyplot as plt

# Create a DataFrame with pass percentages
data = {"Category": ["Boys", "Girls"], "Pass Percentage": [75, 85]}

df = pd.DataFrame(data)

# Plotting the pie chart
df.plot.pie(y="Pass Percentage", labels=df["Category"], figsize=(7, 4))

# Set title and Display the plot
plt.title('Pie Plot for DataFrame')
plt.show()

Output

After executing the above code, we get the following output −
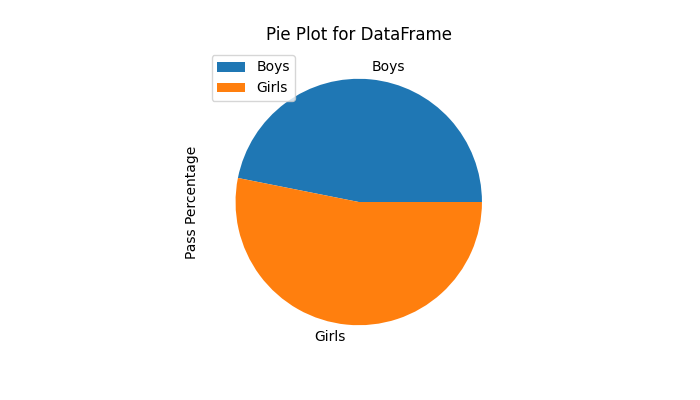
Pie Plot for DataFrame

Customizing a Pie Plot

Pandas allows customization of pie plots through various parameters such as, labels, colors, autopct, fontsize, and more.

Example

This example demonstrates customizing the pie plot using the addition keyword arguments.

import pandas as pd
import matplotlib.pyplot as plt

# Create a DataFrame with pass percentages
data = {
    "Category": ["Boys", "Girls"],
    "Pass Percentage": [75, 85]
}

df = pd.DataFrame(data)

# Plotting the pie chart
df.plot.pie(y="Pass Percentage", labels=df["Category"], 
autopct="%.1f%%", colors=["skyblue", "pink"], figsize=(7, 4))

# Set title and 
plt.title('Customizing a Pie Plot')
plt.show()

Output

Following is the output of the above code −
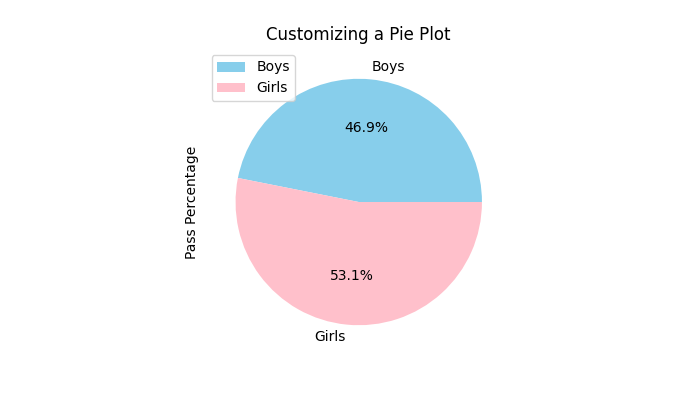
Customizing a Pie Plot

Pie Plots for All DataFrame Columns

When plotting a pie plot from a DataFrame, you must specify a column using the y parameter or use subplots=True to plot multiple pie charts for all numerical columns.

Example

This example demonstrates creating pie plot for all DataFrame columns in a multiple subplots.

import pandas as pd
import matplotlib.pyplot as plt
import numpy as np

# Create a DataFrame 
df = pd.DataFrame(3 * np.random.rand(4, 2), 
index=["a", "b", "c", "d"], 
columns=["Column1", "Column2"])

# Plotting the pie chart
df.plot.pie(subplots=True, autopct="%.1f%%", figsize=(7, 4), title='Pie Plots for All Columns')

# Display the Plot
plt.show()

Output

Following is the output of the above code −
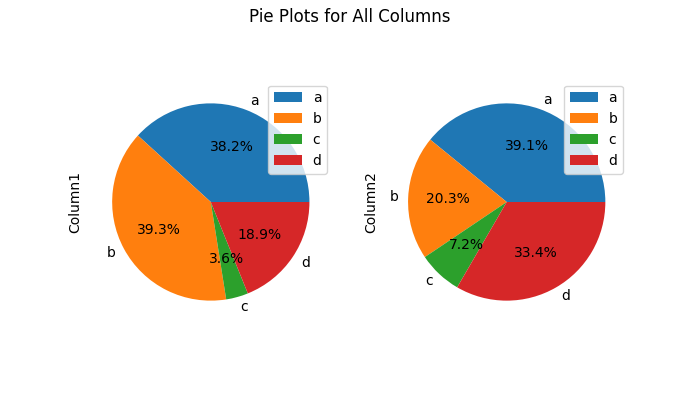
Pie Plots for All Columns

Pie Plot Handling NaN Values

Pandas plot.pie() method easily handles the missing values (NaN), if your data contains any. The method automatically fills the missing data with 0 when creating a pie plot.

Example

The following example shows how the plot.pie() method handles the missing values.

import pandas as pd
import numpy as np
import matplotlib.pyplot as plt

# Create a Pandas Series
series = pd.Series([1, 2, np.nan, 4], index=["A", "B", "C", "D"])

# Generate a pie plot
series.plot.pie(figsize=(7, 4))

# Set title and Display the plot
plt.title('Pie Plot Handling Missing Values')
plt.show()

Output

On executing the above code we will get the following output −
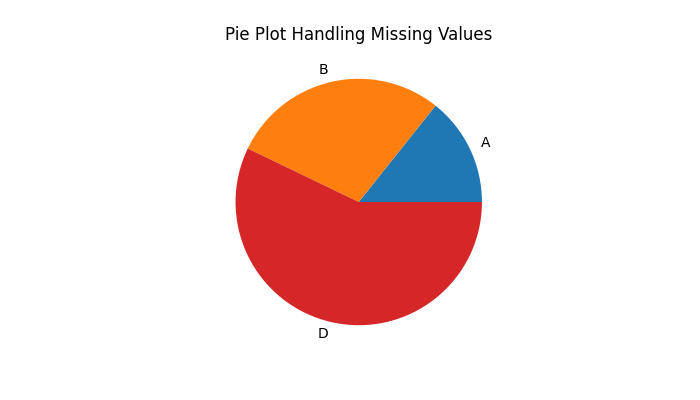
Pie Plot Handling Missing Values
python_pandas_visualization.htm
Tutorix - AI Tutor
Previous Quiz Next
Advertisements
You are visitor 01402503 — GeezerVison does not store the pages you look up.
Best viewed with Netscape Navigator 4.7 or Internet Explorer 6 at 800×600. No cookies required.