GV

GeezerVison

The World Wide Web, restored to 800 pixels of glory.

Home|About|Gaming cabinet|Archives|How it works|Starter sites

On this site

  • Python Technologies
  • Databases
  • Computer Programming
  • Web Development
  • Java Technologies
  • Computer Science
  • Mobile Development
  • Big Data & Analytics
  • Microsoft Technologies
  • DevOps
  • Latest Technologies
  • Machine Learning
  • Digital Marketing
  • Software Quality

This view

  • Original page
  • New address

GeezerVison is showing www.tutorialspoint.com — Statistics - Normal Distribution

Statistics Tutorial
  • Home
  • Adjusted R-Squared
  • Analysis of Variance
  • Arithmetic Mean
  • Arithmetic Median
  • Arithmetic Mode
  • Arithmetic Range
  • Bar Graph
  • Best Point Estimation
  • Beta Distribution
  • Binomial Distribution
  • Black-Scholes model
  • Boxplots
  • Central limit theorem
  • Chebyshev's Theorem
  • Chi-squared Distribution
  • Chi Squared table
  • Circular Permutation
  • Cluster sampling
  • Cohen's kappa coefficient
  • Combination
  • Combination with replacement
  • Comparing plots
  • Continuous Uniform Distribution
  • Continuous Series Arithmetic Mean
  • Continuous Series Arithmetic Median
  • Continuous Series Arithmetic Mode
  • Cumulative Frequency
  • Co-efficient of Variation
  • Correlation Co-efficient
  • Cumulative plots
  • Cumulative Poisson Distribution
  • Data collection
  • Data collection - Questionaire Designing
  • Data collection - Observation
  • Data collection - Case Study Method
  • Data Patterns
  • Deciles Statistics
  • Discrete Series Arithmetic Mean
  • Discrete Series Arithmetic Median
  • Discrete Series Arithmetic Mode
  • Dot Plot
  • Exponential distribution
  • F distribution
  • F Test Table
  • Factorial
  • Frequency Distribution
  • Gamma Distribution
  • Geometric Mean
  • Geometric Probability Distribution
  • Goodness of Fit
  • Grand Mean
  • Gumbel Distribution
  • Harmonic Mean
  • Harmonic Number
  • Harmonic Resonance Frequency
  • Histograms
  • Hypergeometric Distribution
  • Hypothesis testing
  • Individual Series Arithmetic Mean
  • Individual Series Arithmetic Median
  • Individual Series Arithmetic Mode
  • Interval Estimation
  • Inverse Gamma Distribution
  • Kolmogorov Smirnov Test
  • Kurtosis
  • Laplace Distribution
  • Linear regression
  • Log Gamma Distribution
  • Logistic Regression
  • Mcnemar Test
  • Mean Deviation
  • Means Difference
  • Multinomial Distribution
  • Negative Binomial Distribution
  • Normal Distribution
  • Odd and Even Permutation
  • One Proportion Z Test
  • Outlier Function
  • Permutation
  • Permutation with Replacement
  • Pie Chart
  • Poisson Distribution
  • Pooled Variance (r)
  • Power Calculator
  • Probability
  • Probability Additive Theorem
  • Probability Multiplecative Theorem
  • Probability Bayes Theorem
  • Probability Density Function
  • Process Capability (Cp) & Process Performance (Pp)
  • Process Sigma
  • Quadratic Regression Equation
  • Qualitative Data Vs Quantitative Data
  • Quartile Deviation
  • Range Rule of Thumb
  • Rayleigh Distribution
  • Regression Intercept Confidence Interval
  • Relative Standard Deviation
  • Reliability Coefficient
  • Required Sample Size
  • Residual analysis
  • Residual sum of squares
  • Root Mean Square
  • Sample planning
  • Sampling methods
  • Scatterplots
  • Shannon Wiener Diversity Index
  • Signal to Noise Ratio
  • Simple random sampling
  • Skewness
  • Standard Deviation
  • Standard Error ( SE )
  • Standard normal table
  • Statistical Significance
  • Statistics Formulas
  • Statistics Notation
  • Stem and Leaf Plot
  • Stratified sampling
  • Student T Test
  • Sum of Square
  • T-Distribution Table
  • Ti 83 Exponential Regression
  • Transformations
  • Trimmed Mean
  • Type I & II Error
  • Variance
  • Venn Diagram
  • Weak Law of Large Numbers
  • Z table
  • Statistics Useful Resources
  • Statistics - Discussion
Selected Reading
  • UPSC IAS Exams Notes
  • Developer's Best Practices
  • Questions and Answers
  • Online Resume Builder
  • HR Interview Questions
  • Computer Glossary
  • Who is Who

Statistics - Normal Distribution


Previous
Quiz
Next

A normal distribution is an arrangement of a data set in which most values cluster in the middle of the range and the rest taper off symmetrically toward either extreme. Height is one simple example of something that follows a normal distribution pattern: Most people are of average height

the numbers of people that are taller and shorter than average are fairly equal and a very small (and still roughly equivalent) number of people are either extremely tall or extremely short.Here's an example of a normal distribution curve: Normal Distribution
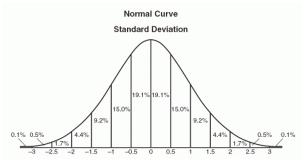
A graphical representation of a normal distribution is sometimes called a bell curve because of its flared shape. The precise shape can vary according to the distribution of the population but the peak is always in the middle and the curve is always symmetrical. In a normal distribution

the mean mode and median are all the same.

Formula

${y = \frac{1}{\sqrt {2 \pi}}e^{\frac{-(x - \mu)^2}{2 \sigma}} }$

Where −

  • ${\mu}$ = Mean

  • ${\sigma}$ = Standard Deviation

  • ${\pi \approx 3.14159}$

  • ${e \approx 2.71828}$

Example

Problem Statement:

A survey of daily travel time had these results (in minutes):

2633652834552544503626374362353845322834

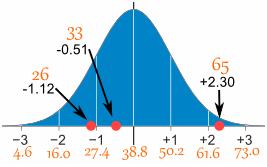
The Mean is 38.8 minutes, and the Standard Deviation is 11.4 minutes. Convert the values to z - scores and prepare the Normal Distribution Graph.

Solution:

The formula for z-score that we have been using:

${z = \frac{x - \mu}{\sigma} }$

Where −

  • ${z}$ = the "z-score" (Standard Score)

  • ${x}$ = the value to be standardized

  • ${\mu}$ = mean

  • ${\sigma}$ = the standard deviation

To convert 26:

First subtract the mean: 26-38.8 = -12.8,

Then divide by the Standard Deviation: -12.8/11.4 = -1.12

So 26 is -1.12 Standard Deviation from the Mean

Here are the first three conversions.

Original ValueCalculationStandard Score (z-score)
26(26-38.8) / 11.4 =-1.12
33(33-38.8) / 11.4 =-0.51
65(65-38.8) / 11.4 =-2.30
.........

And here they graphically represent:

Normal Distribution
Tutorix - AI Tutor
Previous Quiz Next
Advertisements
You are visitor 01402520 — GeezerVison does not store the pages you look up.
Best viewed with Netscape Navigator 4.7 or Internet Explorer 6 at 800×600. No cookies required.