DevTools
Chrome DevTools is a set of web developer tools built directly into the Google Chrome browser. DevTools lets you edit pages on-the-fly and diagnose problems quickly, which helps you build better websites, faster.
AI innovations
Let Gemini help you analyze and improve your website's styling, network, sources, and performance. Get help with console errors, and code suggestions in the Console and Sources panels.
DevTools for agents
Give your coding agents the same trusted tools you use to inspect network activity, record traces, and troubleshoot web applications, within your AI workflow.
Connect the Chrome DevTools MCP (Model Context Protocol) server to your tool of choice: Antigravity, Claude Code, Cline, Copilot, and more.
Connect the Chrome DevTools MCP (Model Context Protocol) server to your tool of choice: Antigravity, Claude Code, Cline, Copilot, and more.
Understand performance
Get a comprehensive and actionable view of your page's performance.
Inspect resources
Learn how to inspect resources loaded by your page and edit them from your browser.
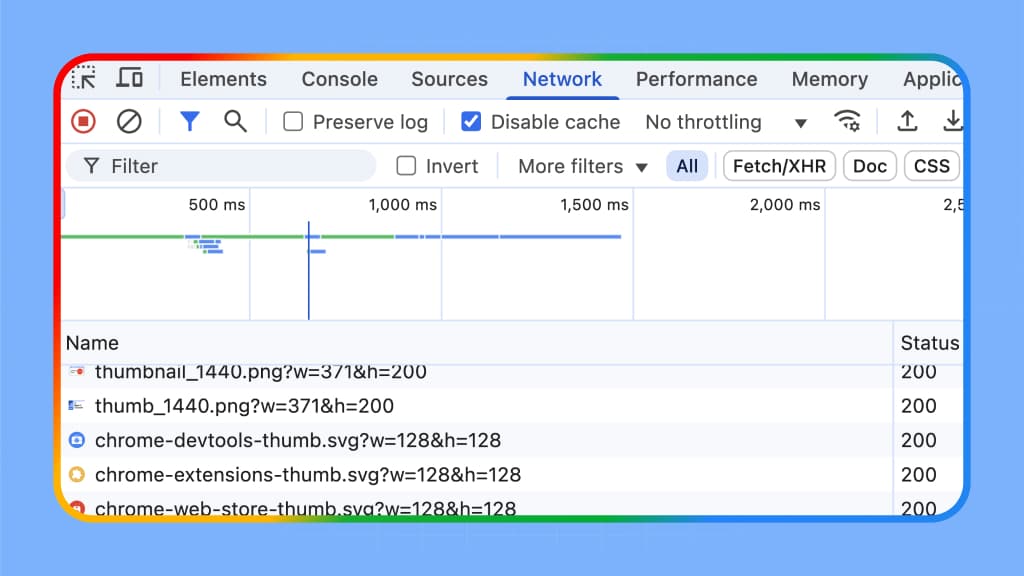
Analyze network
Analyze and overwrite network requests and responses on the fly.
Emulate user experiences with coding agents
Chrome DevTools for agents lets your agent verify responsive layouts, test location-aware APIs, and simulate varied CPU or network speeds.
Automate Lighthouse audits with coding agents
Lighthouse in Chrome DevTools for agents lets your coding agent evaluate website quality by performing live health checks for accessibility, SEO, best practices, and agentic browsing.
Performance optimization Pitstop
Get a tour through the updated Performance panel, showing you how to measure Core Web Vitals (LCP, CLS, INP) and how to get tailored advice from Gemini.
Pixel Pirate
Set sail with DevTools and become a debugging pirate! Discover techniques for emulating focus styles, testing forms with autofill, and resolving backend errors with network overrides.
Performance tool overview
Learn about all the features in the Performance panel: how to record a performance trace, how to view and analyze the trace, and more.
Monitor your local and real-user Core Web Vitals performance in DevTools
Learn about new DevTools features like CPU throttling calibration to help you base your performance debugging decisions on data from the real world
Insights sidebar in the DevTools Performance panel
Learn about the new performance insights, the power of Lighthouse directly in the DevTools Performance panel.
Feature reference
Learn about all the features in the Sources panel: how to view and edit files, debug JavaScript, and set up a workspace.
Set up a workspace
Workspace lets you to save changes that you make within DevTools to source code that's stored on your computer. Learn how to set up a workspace in your own projects.
Network panel
Learn about all the features in the Network panel: inspect response and request bodies, overwrite headers, and more.
Inspect network activity
A hands-on tutorial to guide you through common tasks inside the Network panel.
Elements
Learn how to view and change a page's DOM.
Styles
Learn how to view and change a page's CSS.
Changes
Track changes to HTML, CSS, and JavaScript.
Console
Log messages and run JavaScript.
Performance
Evaluate website performance.
Memory
Find memory issues that affect page performance, including memory leaks, and more.
Application
Inspect, modify, and debug web apps, test cache, view storage, and more.
Animations
Inspect and modify animations.
Recorder
Record, replay, measure user flows, and edit their steps.
Rendering
Discover a collection of options that affect web content rendering.
Autofill
Inspect and debug saved addresses.
Issues
Find and fix problems with your website.
Privacy & Security
Make sure that a page is fully protected by HTTPS.
Media
View information and debug media players per browser tab.
Sensors
Emulate device sensors.
WebAuthn
Emulate authenticators.