GV

GeezerVison

The World Wide Web, restored to 800 pixels of glory.

Home|About|Gaming cabinet|Archives|How it works|Starter sites

On this site

  • Sign in
  • ActionsCI/CD and automation
  • CodespacesCloud development environments
  • All Features
  • Documentation
  • Training
  • Certifications
  • Build with Copilot
  • Customize Copilot
  • Integrations
  • Trending repos
  • GitHub Sponsors
  • Developer articles
  • Enterprises

This view

  • Original page
  • New address

GeezerVison is showing github.com — GitHub - fabilab/iplotx: Visualise networks and trees in Python, with style.

BranchesTags
Open more actions menu

Latest commit


History

432 Commits
432 Commits

Folders and files

NameName
Last commit message
Last commit date
.github/workflows
.github/workflows
 
 
assets
assets
 
 
docs
docs
 
 
gallery
gallery
 
 
iplotx
iplotx
 
 
scripts
scripts
 
 
tests
tests
 
 
.gitignore
.gitignore
 
 
.pre-commit-config.yaml
 
 
.readthedocs.yaml
.readthedocs.yaml
 
 
LICENSE
LICENSE
 
 
MANIFEST.in
MANIFEST.in
 
 
README.md
README.md
 
 
pyproject.toml
pyproject.toml
 
 
uv.lock
uv.lock


Repository files navigation

Github Actions PyPI - Version RTD Coverage Status pylint DOI

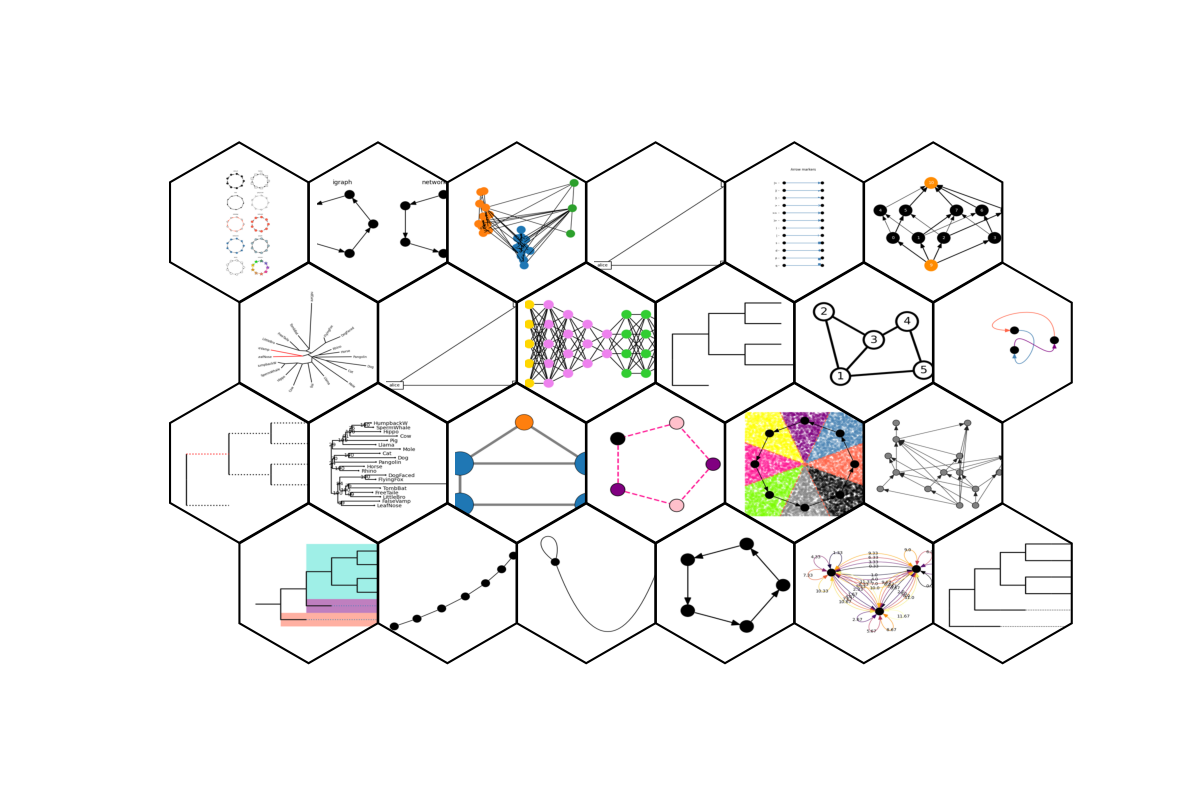
iplotx

Banner.

Visualise networks and trees in Python, with style.

Supports:

  • networks:
    • networkx
    • igraph
    • graph-tool
    • zero-dependency
  • trees:
    • ETE4
    • cogent3
    • phyloframe
    • Biopython
    • scikit-bio
    • dendropy
    • zero-dependency

In addition to the above, any network or tree analysis library can register an entry point to gain compatibility with iplotx with no intervention from our side.

Installation

pip install iplotx

Quick Start

import networkx as nx
import matplotlib.pyplot as plt
import iplotx as ipx

g = nx.Graph([(0, 1), (1, 2), (2, 3), (3, 4), (4, 0)])
layout = nx.layout.circular_layout(g)
ipx.plot(g, layout)

Quick start image

Documentation

See documentation and gallery.

Citation

If you use iplotx for publication figures, please cite:

F. Zanini. A universal tool for visualisation of networks and trees in Python. F1000Research 2025, 14:1377. https://doi.org/10.12688/f1000research.173131.1

Features

  • Plot networks from multiple libraries including networkx, igraph and graph-tool, using Matplotlib. ✅
  • Plot trees from multiple libraries such as cogent3, ETE4, phyloframe, skbio, biopython, and dendropy. ✅
  • Flexible yet easy styling, including an internal library of styles ✅
  • Interactive plotting, e.g. zooming and panning after the plot is created. ✅
  • Store the plot to disk in many formats (SVG, PNG, PDF, GIF, etc.). ✅
  • 3D network visualisation with depth shading. ✅
  • Efficient plotting of large graphs (up to ~1 million nodes on a laptop). ✅
  • Edit plotting elements after the plot is created, e.g. changing node colors, labels, etc. ✅
  • Animations, e.g. showing the evolution of a network over time. ✅
  • Mouse and keyboard interaction, e.g. hovering over nodes/edges to get information about them. ✅
  • Node clustering and covers, e.g. showing communities in a network. ✅
  • Edge tension, edge waypoints, and edge ports. ✅
  • Choice of tree layouts and orientations. ✅
  • Tree-specific options: cascades, subtree styling, split edges, etc. ✅
  • (WIP) Support uni- and bi-directional communication between graph object and plot object.🏗️

Authors

Fabio Zanini (https://fabilab.org)

About

Visualise networks and trees in Python, with style.

iplotx.readthedocs.io

Topics

biopythoncogent3graphsigraphmatplotlibnetworksnetworkxplottingpythonscikit-biovisualization

Resources

Readme
MIT license
Activity
Custom properties

Stars

92 stars

Watchers

2 watching

Forks

3 forks
Report repository

Releases

Used by

Contributors

Languages

You are visitor 01402503 — GeezerVison does not store the pages you look up.
Best viewed with Netscape Navigator 4.7 or Internet Explorer 6 at 800×600. No cookies required.