GeezerVisonThe World Wide Web, restored to 800 pixels of glory. |
| Home|About|Gaming cabinet|Archives|How it works|Starter sites |
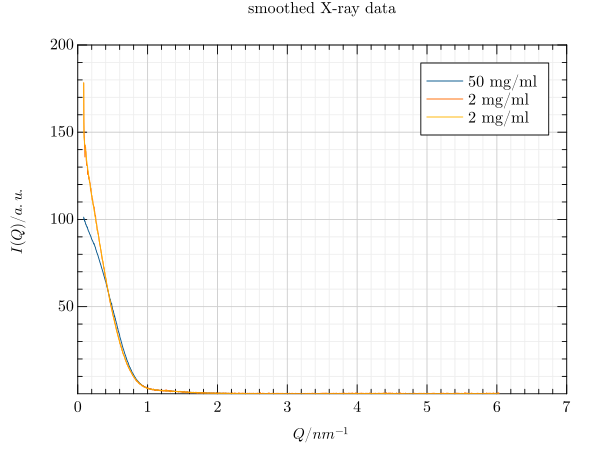
GeezerVison is showing gr-framework.org — Tutorial — GR Framework 0.73.27 documentation Tutorial¶The following steps showcase a workflow with GRPlot. This tutorial uses the smooth_xraydata dataset. Create the initial plot from the command line. The grplot smooth_xraydata.dat kind:line If Key-value pairs can also be declared in the data header, which - in this example case - define the title and the axis labels. These also include the y limits, which define the visible area of the y-axis and the labels of the three series. # title : smoothed X-ray data # x_label : $Q / nm^{-1}$ # y_label : $I(Q) / a.u.$ # y_lim : 0.05,200 # x_columns:1 # y_columns:2,3,4 # legend: Q,50 mg/ml,2 mg/ml,2 mg/ml spline The result is in the following image: As we cannot see much, we would like to use a logarithmic y-axis. This can be achieved using the toolbar.
This is much better, but we would like to replace the blue and orange lines with a scatter plot. To do this, we first need to enable the editor. Then, we select the desired series and change its type in the newly opened dock widget.
Next, we select the new scatter plot and adjust the type, size and color of the marker.
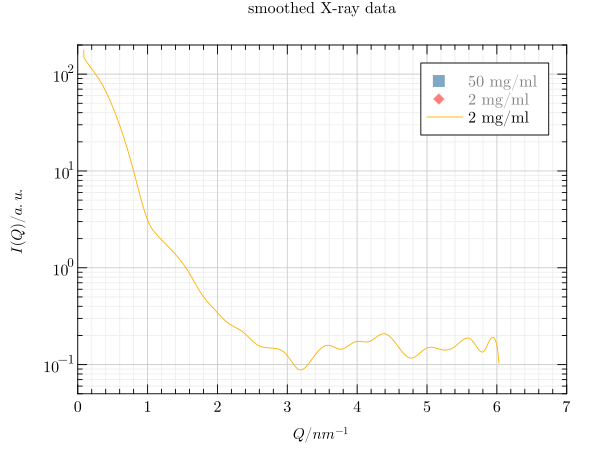
If we are only interested in one series, we can hide the others by deselecting them in the legend.
If known in advance, changes such as the use of a logarithmic y-axis or the combination of different types can be achieved via key-value pairs on the command line. However, the size, color and type of the marker would still need to be configured in the editor to recreate the same image. grplot smooth_xraydata.dat kind:scatter,,line y_log:1 |
| You are visitor 01402503 — GeezerVison does not store the pages you look up. Best viewed with Netscape Navigator 4.7 or Internet Explorer 6 at 800×600. No cookies required. |