GV

GeezerVison

The World Wide Web, restored to 800 pixels of glory.

Home|About|Gaming cabinet|Archives|How it works|Starter sites

On this site

  • Plot types
  • User guide
  • Tutorials
  • Examples
  • Reference
  • Contribute
  • Releases
  • Gitter
  • Discourse
  • GitHub
  • Pairwise data
  • plot(x, y)
  • scatter(x, y)
  • bar(x, height)

This view

  • Original page
  • New address

GeezerVison is showing matplotlib.org — Plot types — Matplotlib 3.11.2 documentation

Plot types#

Overview of many common plotting commands provided by Matplotlib.

See the gallery for more examples and the tutorials page for longer examples.

Pairwise data#

Plots of pairwise \((x, y)\), tabular \((var\_0, \cdots, var\_n)\), and functional \(f(x)=y\) data.
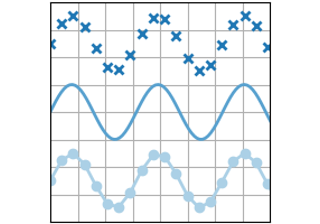
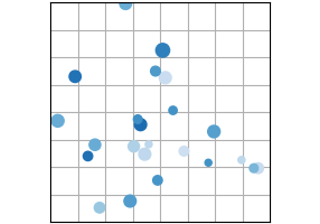
plot(x, y)

plot(x, y)

scatter(x, y)

scatter(x, y)

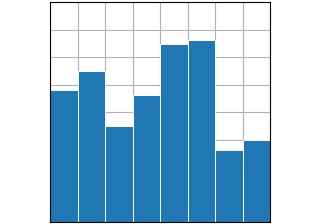
bar(x, height)

bar(x, height)

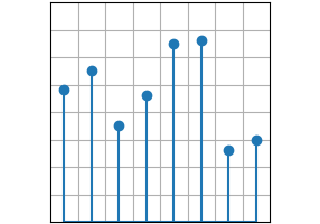
stem(x, y)

stem(x, y)

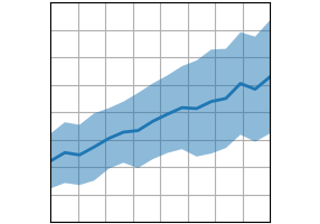
fill_between(x, y1, y2)

fill_between(x, y1, y2)

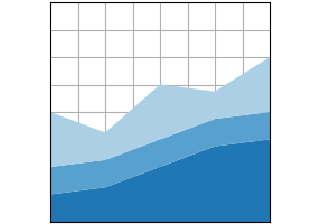
stackplot(x, y)

stackplot(x, y)

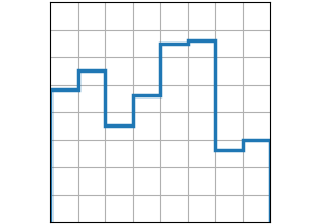
stairs(values)

stairs(values)

Statistical distributions#

Plots of the distribution of at least one variable in a dataset. Some of these methods also compute the distributions.
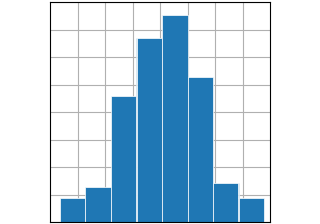
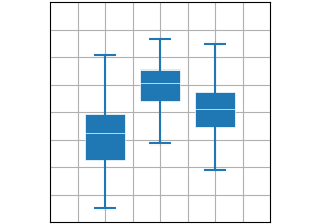
hist(x)

hist(x)

boxplot(X)

boxplot(X)

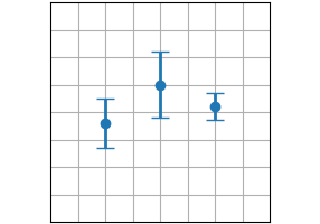
errorbar(x, y, yerr, xerr)

errorbar(x, y, yerr, xerr)

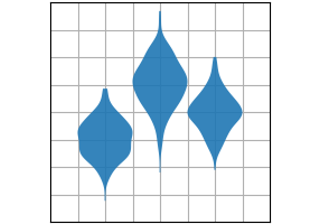
violinplot(D)

violinplot(D)

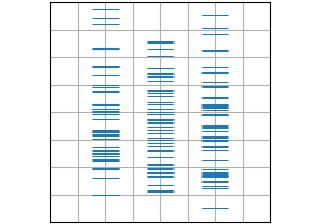
eventplot(D)

eventplot(D)

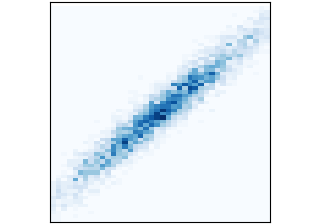
hist2d(x, y)

hist2d(x, y)

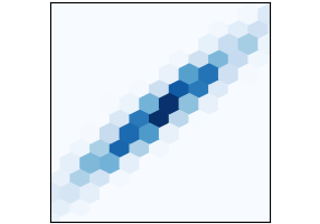
hexbin(x, y, C)

hexbin(x, y, C)

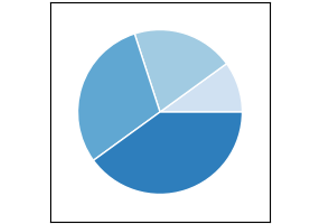
pie(x)

pie(x)

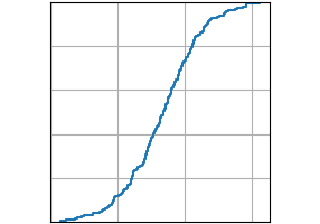
ecdf(x)

ecdf(x)

Gridded data#

Plots of arrays and images \(Z_{i, j}\) and fields \(U_{i, j}, V_{i, j}\) on regular grids and corresponding coordinate grids \(X_{i,j}, Y_{i,j}\).
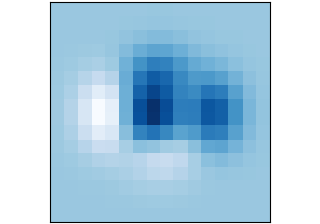
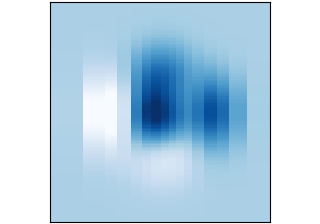
imshow(Z)

imshow(Z)

pcolormesh(X, Y, Z)

pcolormesh(X, Y, Z)

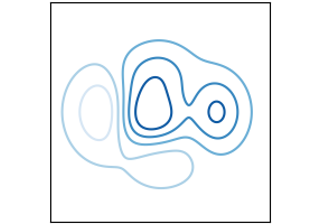
contour(X, Y, Z)

contour(X, Y, Z)

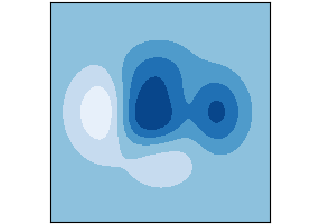
contourf(X, Y, Z)

contourf(X, Y, Z)

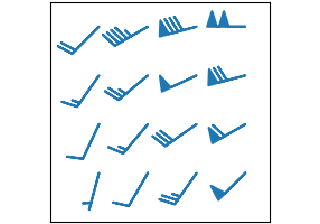
barbs(X, Y, U, V)

barbs(X, Y, U, V)

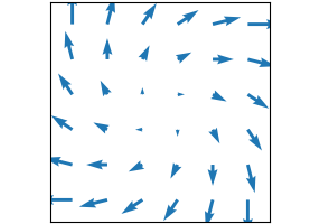
quiver(X, Y, U, V)

quiver(X, Y, U, V)

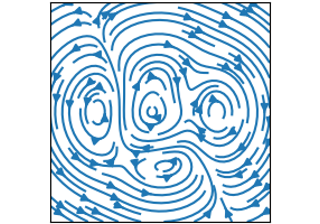
streamplot(X, Y, U, V)

streamplot(X, Y, U, V)

Irregularly gridded data#

Plots of data \(Z_{x, y}\) on unstructured grids , unstructured coordinate grids \((x, y)\), and 2D functions \(f(x, y) = z\).

tricontour(x, y, z)

tricontour(x, y, z)

tricontourf(x, y, z)

tricontourf(x, y, z)

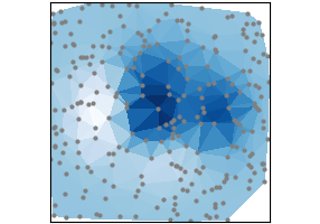
tripcolor(x, y, z)

tripcolor(x, y, z)

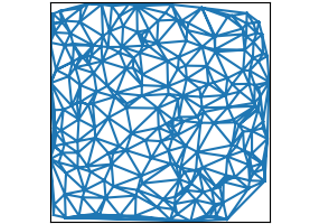
triplot(x, y)

triplot(x, y)

3D and volumetric data#

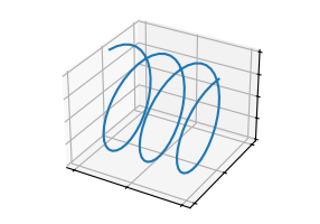
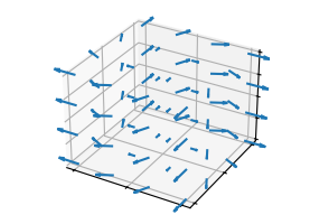
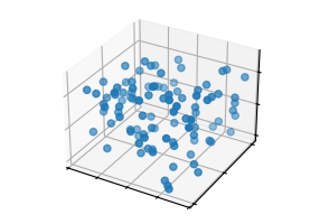
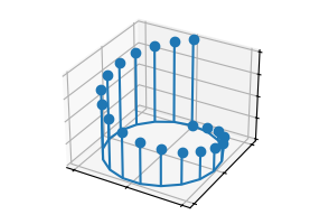
Plots of three-dimensional \((x,y,z)\), surface \(f(x,y)=z\), and volumetric \(V_{x, y, z}\) data using the mpl_toolkits.mplot3d library.
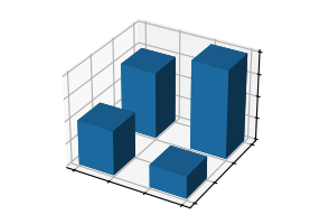
bar3d(x, y, z, dx, dy, dz)

bar3d(x, y, z, dx, dy, dz)

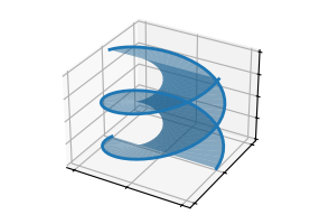
fill_between(x1, y1, z1, x2, y2, z2)

fill_between(x1, y1, z1, x2, y2, z2)

plot(xs, ys, zs)

plot(xs, ys, zs)

quiver(X, Y, Z, U, V, W)

quiver(X, Y, Z, U, V, W)

scatter(xs, ys, zs)

scatter(xs, ys, zs)

stem(x, y, z)

stem(x, y, z)

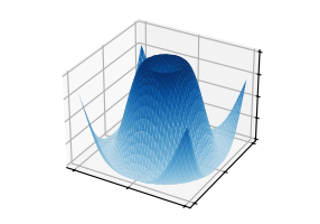
plot_surface(X, Y, Z)

plot_surface(X, Y, Z)

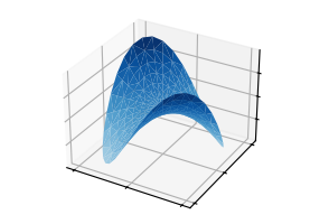
plot_trisurf(x, y, z)

plot_trisurf(x, y, z)

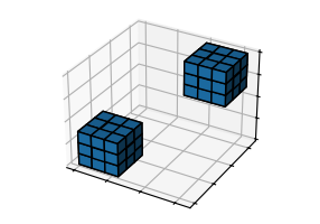
voxels([x, y, z], filled)

voxels([x, y, z], filled)

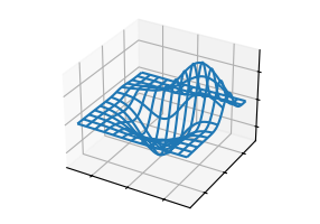
plot_wireframe(X, Y, Z)

plot_wireframe(X, Y, Z)

Download all examples in Python source code: plot_types_python.zip

Download all examples in Jupyter notebooks: plot_types_jupyter.zip

Gallery generated by Sphinx-Gallery

On this page
You are visitor 01402503 — GeezerVison does not store the pages you look up.
Best viewed with Netscape Navigator 4.7 or Internet Explorer 6 at 800×600. No cookies required.