GV

GeezerVison

The World Wide Web, restored to 800 pixels of glory.

Home|About|Gaming cabinet|Archives|How it works|Starter sites

On this site

  • Our World in Data
  • Data
  • Latest
  • Donate
  • Hannah Ritchie
  • Pablo Rosado
  • Veronika Samborska

This view

  • Original page
  • New address

GeezerVison is showing ourworldindata.org — Climate Change

Current climate change is primarily caused by human emissions of greenhouse gases. This warming can drive large changes in sea level, sea ice and glacier balances, rainfall patterns, and extreme temperatures. This has potentially devastating impacts on human health, farming systems, the stability of societies, and other species.

To limit and stop climate change, we need to greatly reduce global emissions of greenhouse gases. We cover these emissions in our work on CO2 and other greenhouse gas emissions. This will require massive shifts in our energy and food systems, which we also cover in detail.

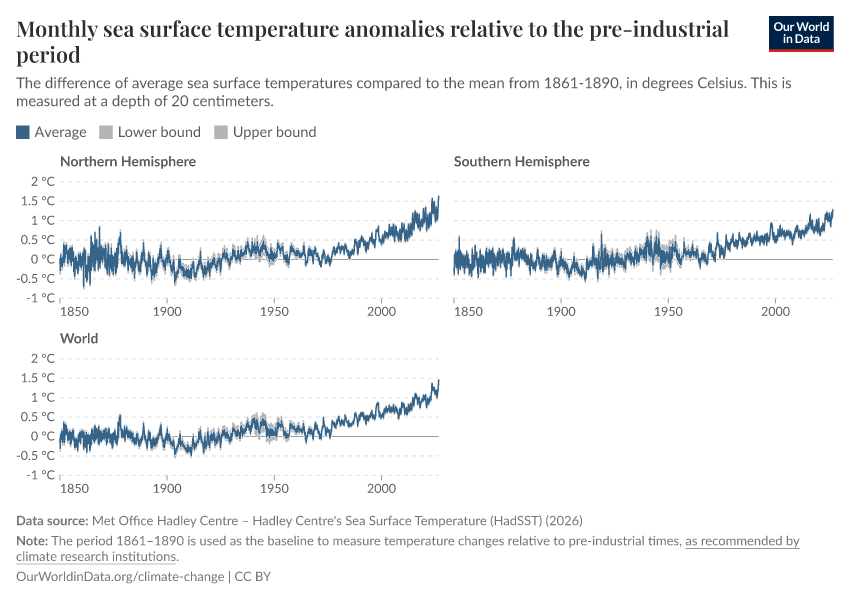
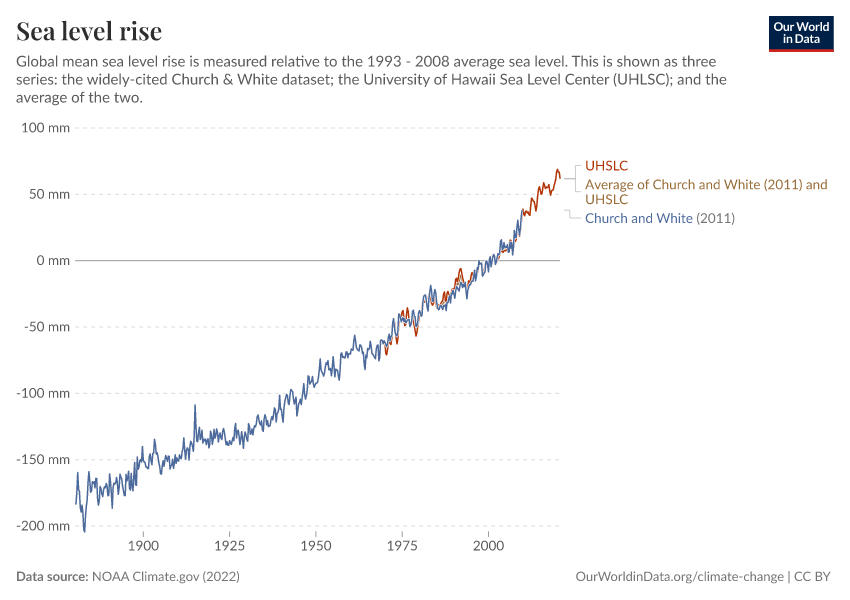
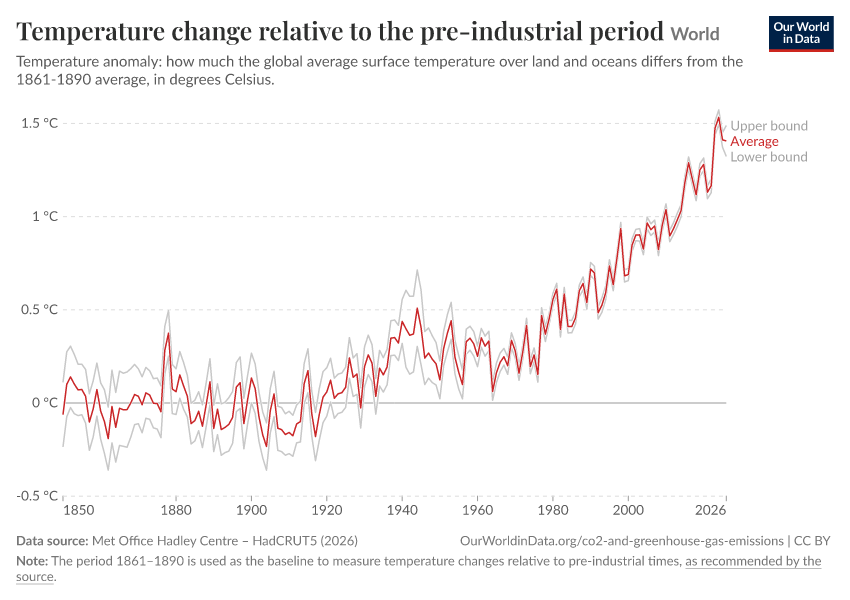
On this page, you will find global data and research on the impacts of climate change, including temperature anomalies, sea level rise, sea ice melt, glacier loss, and ocean acidification.

See all of our interactive charts on climate change ↓

Related Topics

  • CO₂ and Greenhouse Gas Emissions
  • Energy
  • Air Pollution
  • Natural Disasters

Research & Writing

Thumbnail

March 25, 2024

More people care about climate change than you think

The majority of people in every country support action on climate, but the public consistently underestimates this share.

Hannah Ritchie

Thumbnail

March 18, 2024

How much have temperatures risen in countries across the world?

Explore country-by-country data on monthly temperature anomalies.

Veronika Samborska

Thumbnail

September 29, 2023

How much CO2 can the world emit while keeping warming below 1.5°C and 2°C?

The budget to keep temperatures below 1.5°C is less than a decade of current emissions. For 2°C, it’s less than three decades.

Hannah Ritchie

More articles on climate change

Featured image.

March 3, 2025

“Cool” years are now hotter than the “warm” years of the past: tracking global temperatures through El Niño and La Niña

Veronika Samborska and Hannah Ritchie

Featured image

October 28, 2024

Climate change will affect food production, but here are the things we can do to adapt

Hannah Ritchie

Featured image

October 14, 2024

How will climate change affect crop yields in the future?

Hannah Ritchie

Featured image

September 30, 2024

Crop yields have increased dramatically in recent decades, but crops like maize would have improved more without climate change

Hannah Ritchie

Featured image

July 29, 2024

Air conditioning causes around 3% of greenhouse gas emissions. How will this change in the future?

Hannah Ritchie

Featured image

July 22, 2024

How can the world reduce deaths from extreme heat?

Hannah Ritchie

Featured image

July 1, 2024

How many people die from extreme temperatures, and how this could change in the future: Part one

Hannah Ritchie

Featured image

July 1, 2024

How many people die from extreme temperatures, and how this could change in the future: Part two

Hannah Ritchie

September 29, 2020

We teamed up with Kurzgesagt to make a video about climate change: 'Is It Too Late To Stop Climate Change? Well, it's Complicated'

Hannah Ritchie

June 22, 2020

We teamed up with Kurzgesagt to make a video about climate change: 'Who Is Responsible For Climate Change? – Who Needs To Fix It?'

Hannah Ritchie

Related work on climate change and its impacts

A dark blue background with a lighter blue world map superimposed over it. Yellow text that says CO2 and Greenhouse Gas Emissions by Our World in Data

December 5, 2023

CO₂ and Greenhouse Gas Emissions

Hannah Ritchie, Pablo Rosado, and Max Roser

December 20, 2023

Energy

Hannah Ritchie, Pablo Rosado, and Max Roser

Featured image

April 2, 2024

Wildfires

Veronika Samborska, Hannah Ritchie, and Pablo Rosado

Thumbnail

December 7, 2022

Natural Disasters

Hannah Ritchie, Pablo Rosado, and Max Roser

Key Charts on Climate Change

See all charts on this topic
  • A thumbnail of the "Global temperature anomalies by month" chartGlobal temperature anomalies by month
  • A thumbnail of the "Annual sea surface temperature anomalies relative to the pre-industrial period" chartAnnual sea surface temperature anomalies relative to the pre-industrial period
  • A thumbnail of the "Antarctic sea ice extent" chartAntarctic sea ice extent
  • A thumbnail of the "Arctic sea ice extent" chartArctic sea ice extent
  • A thumbnail of the "Carbon dioxide concentration in the atmosphere" chartCarbon dioxide concentration in the atmosphere
  • A thumbnail of the "Ice sheet mass balance" chartIce sheet mass balance
  • A thumbnail of the "Monthly average ocean heat content in the top 2,000 meters" chartMonthly average ocean heat content in the top 2,000 meters
  • A thumbnail of the "Monthly average ocean heat content in the top 700 meters" chartMonthly average ocean heat content in the top 700 meters
  • A thumbnail of the "Monthly sea surface temperature anomalies relative to the pre-industrial period" chartMonthly sea surface temperature anomalies relative to the pre-industrial period
  • A thumbnail of the "Ocean acidification: mean seawater pH" chartOcean acidification: mean seawater pH
  • A thumbnail of the "Sea level rise" chartSea level rise
  • A thumbnail of the "Temperature change relative to the pre-industrial period" chartTemperature change relative to the pre-industrial period
  • A thumbnail of the "Annual temperature anomalies" chartAnnual temperature anomalies
  • A thumbnail of the "Autumn temperature anomalies" chartAutumn temperature anomalies
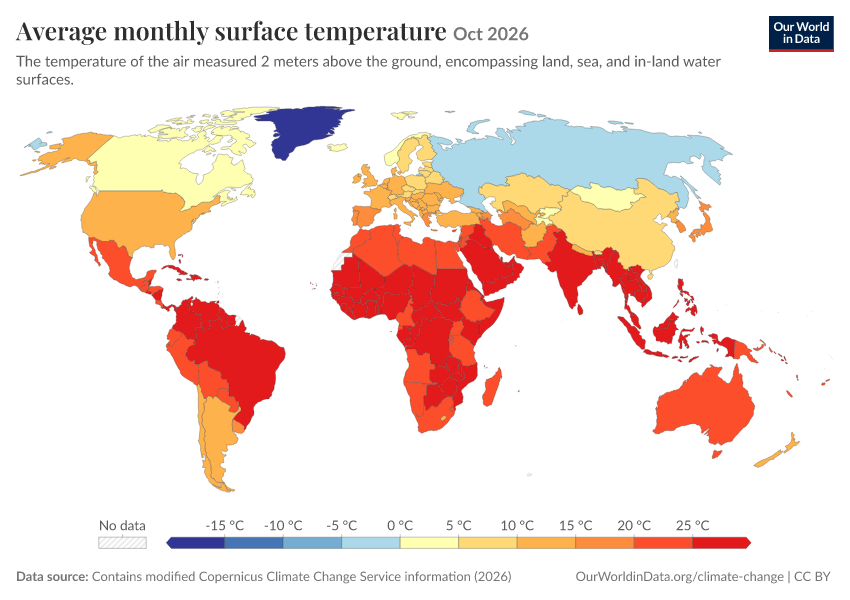
  • A thumbnail of the "Average monthly surface temperature" chartAverage monthly surface temperature
  • A thumbnail of the "Concentration of nitrous oxide in the atmosphere" chartConcentration of nitrous oxide in the atmosphere
  • A thumbnail of the "Decadal temperature anomalies" chartDecadal temperature anomalies
  • A thumbnail of the "Glaciers: change of mass of US glaciers" chartGlaciers: change of mass of US glaciers
  • A thumbnail of the "Global atmospheric CO₂ concentration" chartGlobal atmospheric CO₂ concentration
  • A thumbnail of the "Global atmospheric methane concentrations" chartGlobal atmospheric methane concentrations
  • A thumbnail of the "Global atmospheric nitrous oxide concentration" chartGlobal atmospheric nitrous oxide concentration
  • A thumbnail of the "Global temperature anomalies by El Niño and La Niña and month" chartGlobal temperature anomalies by El Niño and La Niña and month
  • A thumbnail of the "Global temperature anomalies by El Niño and La Niña conditions" chartGlobal temperature anomalies by El Niño and La Niña conditions
  • A thumbnail of the "Global warming contributions by gas and source" chartGlobal warming contributions by gas and source
  • A thumbnail of the "Global warming contributions from fossil fuels and land use" chartGlobal warming contributions from fossil fuels and land use
  • A thumbnail of the "Global warming: Contributions to the change in global mean surface temperature" chartGlobal warming: Contributions to the change in global mean surface temperature
  • A thumbnail of the "Heat content in the top 2,000 meters of the world's oceans" chartHeat content in the top 2,000 meters of the world's oceans
  • A thumbnail of the "Heat content in the top 700 meters of the world's oceans" chartHeat content in the top 700 meters of the world's oceans
  • A thumbnail of the "Methane concentration in the atmosphere" chartMethane concentration in the atmosphere
  • A thumbnail of the "Monthly average surface temperatures by decade" chartMonthly average surface temperatures by decadedecadal
  • A thumbnail of the "Monthly average surface temperatures by year" chartMonthly average surface temperatures by year
  • A thumbnail of the "Monthly sea ice extent in the Antarctic" chartMonthly sea ice extent in the Antarctic
  • A thumbnail of the "Monthly sea ice extent in the Antarctic, decadal average" chartMonthly sea ice extent in the Antarctic, decadal average
  • A thumbnail of the "Monthly sea ice extent in the Arctic" chartMonthly sea ice extent in the Arctic
  • A thumbnail of the "Monthly sea ice extent in the Arctic, decadal average" chartMonthly sea ice extent in the Arctic, decadal average
  • A thumbnail of the "Monthly surface temperature anomalies by decade" chartMonthly surface temperature anomalies by decadedecadal
  • A thumbnail of the "Monthly surface temperature anomalies by year" chartMonthly surface temperature anomalies by year
  • A thumbnail of the "Monthly temperature anomalies" chartMonthly temperature anomalies
  • A thumbnail of the "People underestimate others' willingness to take climate action" chartPeople underestimate others' willingness to take climate action
  • A thumbnail of the "Sea ice anomalies in the Antarctic by month" chartSea ice anomalies in the Antarctic by month
  • A thumbnail of the "Sea ice anomalies in the Arctic by month" chartSea ice anomalies in the Arctic by month
  • A thumbnail of the "Seasonal temperature anomalies in the United States" chartSeasonal temperature anomalies in the United States
  • A thumbnail of the "Share of people who believe in climate change and think it's a serious threat to humanity" chartShare of people who believe in climate change and think it's a serious threat to humanity
  • A thumbnail of the "Share of people who say their government should do more to tackle climate change" chartShare of people who say their government should do more to tackle climate change
  • A thumbnail of the "Share of people who support policies to tackle climate change" chartShare of people who support policies to tackle climate change
  • A thumbnail of the "Share that think people in their country should act to tackle climate change" chartShare that think people in their country should act to tackle climate change
  • A thumbnail of the "Snow cover in North America" chartSnow cover in North America
  • A thumbnail of the "Spring temperature anomalies" chartSpring temperature anomalies
  • A thumbnail of the "Summer temperature anomalies" chartSummer temperature anomalies
  • A thumbnail of the "Temperature anomalies by month" chartTemperature anomalies by month
  • A thumbnail of the "Winter temperature anomalies" chartWinter temperature anomalies
  • A thumbnail of the "Countries with national adaptation plans for climate change" chartCountries with national adaptation plans for climate change
  • A thumbnail of the "Financial support provided through the Green Climate Fund" chartFinancial support provided through the Green Climate Fund
  • A thumbnail of the "Nationally determined contributions to climate change" chartNationally determined contributions to climate change
  • A thumbnail of the "Opinions of young people on the threats of climate change" chartOpinions of young people on the threats of climate change
  • A thumbnail of the "Projected number of air conditioning units" chartProjected number of air conditioning units
  • A thumbnail of the "Share of households with air conditioning" chartShare of households with air conditioning
Chart 1 of 57

Cite this work

Our articles and data visualizations rely on work from many different people and organizations. When citing this topic page, please also cite the underlying data sources. This topic page can be cited as:

Hannah Ritchie, Pablo Rosado, and Veronika Samborska (2024) - “Climate Change” Published online at OurWorldinData.org. Retrieved from: 'https://ourworldindata.org/climate-change' [Online Resource]

BibTeX citation

@article{owid-climate-change,
    author = {Hannah Ritchie and Pablo Rosado and Veronika Samborska},
    title = {Climate Change},
    journal = {Our World in Data},
    year = {2024},
    note = {https://ourworldindata.org/climate-change}
}
Our World in Data logo

Reuse this work freely

All visualizations, data, and articles produced by Our World in Data are completely open access under the Creative Commons BY license. You have the permission to use, distribute, and reproduce these in any medium, provided the source and authors are credited.

The data produced by third parties and made available by Our World in Data is subject to the license terms from the original third-party authors. We will always indicate the original source of the data in our documentation, so you should always check the license of any such third-party data before use and redistribution.

All of our charts can be embedded in any site.

You are visitor 01402503 — GeezerVison does not store the pages you look up.
Best viewed with Netscape Navigator 4.7 or Internet Explorer 6 at 800×600. No cookies required.