GV

GeezerVison

The World Wide Web, restored to 800 pixels of glory.

Home|About|Gaming cabinet|Archives|How it works|Starter sites

On this site

  • Our World in Data
  • Data
  • Latest
  • Donate
  • Max Roser
  • Hannah Ritchie
  • Edouard Mathieu

This view

  • Original page
  • New address

GeezerVison is showing ourworldindata.org — Technological Change

Almost every development we cover on Our World in Data is underpinned by technological change.

Medical innovations contributed to the decline in child mortality and the improvement in life expectancy. Thanks to the advances in agricultural technologies, higher crop yields and less undernourishment became possible. The long-term decline of global poverty was primarily driven by increased productivity from technological change. Access to energy, electricity, sanitation, and clean water has transformed the lives of billions. Transport, telephones, and the Internet have allowed us to collaborate on problems at a global level.

Emerging technologies are often expensive and, therefore, initially limited to society's richest. A key part of technological progress is making these life-changing and often life-saving innovations affordable for everyone.

Technology has improved our lives in many ways, but these developments are not always positive. Many of humanity’s largest threats — such as nuclear weapons and potentially artificial intelligence — result from technological advances. To mitigate these risks, good governance can be as important as the technology itself.

On this page, you can find our data, visualizations, and writing on the most fundamental technological changes that have shaped our world.

Related Topics

  • Artificial Intelligence
  • Space Exploration and Satellites
  • Internet
  • Light at Night

Research & Writing

Key Articles on Technological Change

February 22, 2023

Technology over the long run: zoom out to see how dramatically the world can change within a lifetime

Max Roser

December 6, 2022

The brief history of artificial intelligence: the world has changed fast — what might be next?

Max Roser

December 15, 2022

Artificial intelligence is transforming our world — it is on all of us to make sure that it goes well

Max Roser

Featured image

March 30, 2026

Battery costs have declined by 99% in the last three decades, making electrified transport a reality

Hannah Ritchie and Pablo Rosado

Artificial Intelligence (AI) and Communication Technologies

February 7, 2023

AI timelines: What do experts in artificial intelligence expect for the future?

Max Roser

March 29, 2023

Artificial intelligence has advanced despite having few resources dedicated to its development — now investments have increased substantially

Max Roser

November 7, 2019

The importance of social networks for innovation and productivity

Esteban Ortiz-Ospina

September 18, 2019

The rise of social media

Esteban Ortiz-Ospina

Energy and Agricultural Technologies

December 1, 2020

Why did renewables become so cheap so fast?

Max Roser

Line chart of three time series where one series rises fastest and reaches the highest values, a second series grows steadily in the middle, and a third series starts low then accelerates later to nearly match the middle series.

November 7, 2017

How many people does synthetic fertilizer feed?

Hannah Ritchie

August 22, 2017

Yields vs. land use: how the Green Revolution enabled us to feed a growing population

Hannah Ritchie

September 13, 2019

The world now produces more seafood from fish farms than wild catch

Hannah Ritchie

Theory of Technological Change

Featured image for an article on Moore's Law

March 28, 2023

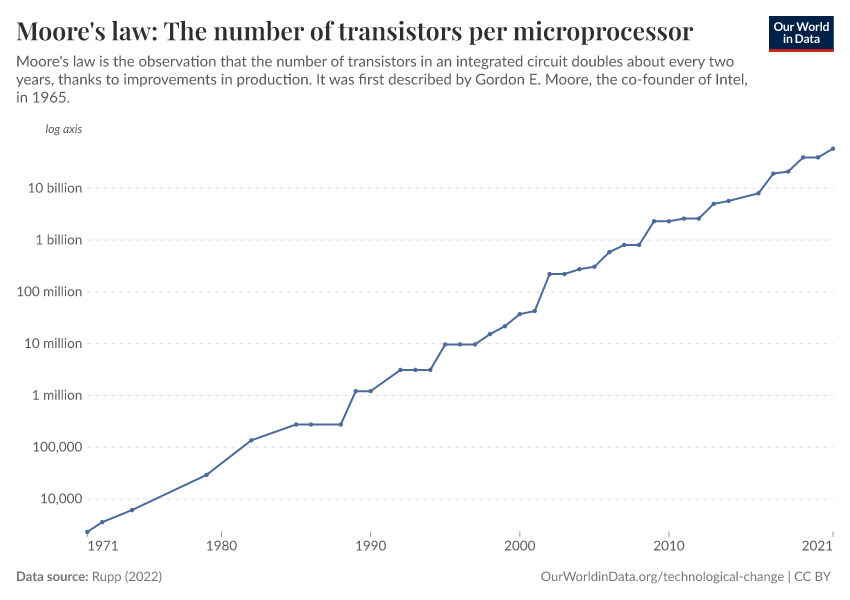
What is Moore’s Law?

Max Roser, Hannah Ritchie, and Edouard Mathieu

April 18, 2023

Learning curves: What does it mean for a technology to follow Wright’s Law?

Max Roser

Key Charts on Technological Change

See all charts on this topic
  • A thumbnail of the "Cost of sequencing a full human genome" chartCost of sequencing a full human genome
  • A thumbnail of the "Historical price of computer memory and storage" chartHistorical price of computer memory and storage
  • A thumbnail of the "Moore's law: The number of transistors per microprocessor" chartMoore's law: The number of transistors per microprocessor
  • A thumbnail of the "Share of the population using the Internet" chartShare of the population using the Internet
  • A thumbnail of the "Solar photovoltaic panel prices" chartSolar photovoltaic panel prices
  • A thumbnail of the "Active mobile money accounts" chartActive mobile money accounts
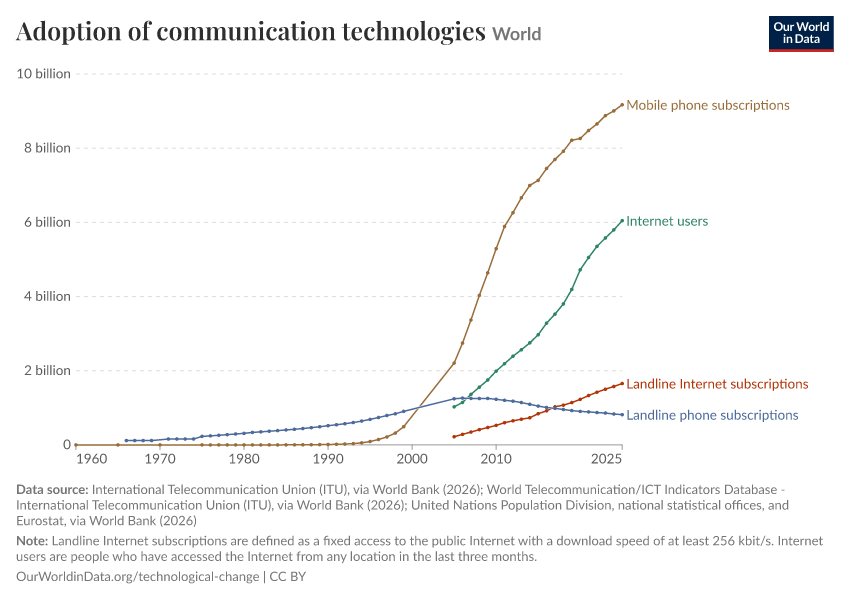
  • A thumbnail of the "Adoption of communication technologies" chartAdoption of communication technologiesAbsolute numbers
  • A thumbnail of the "Adoption of communication technologies per 100 people" chartAdoption of communication technologies per 100 people
  • A thumbnail of the "Annual number of objects launched into space" chartAnnual number of objects launched into space
  • A thumbnail of the "Annual professional service robots installed globally, by application area" chartAnnual professional service robots installed globally, by application area
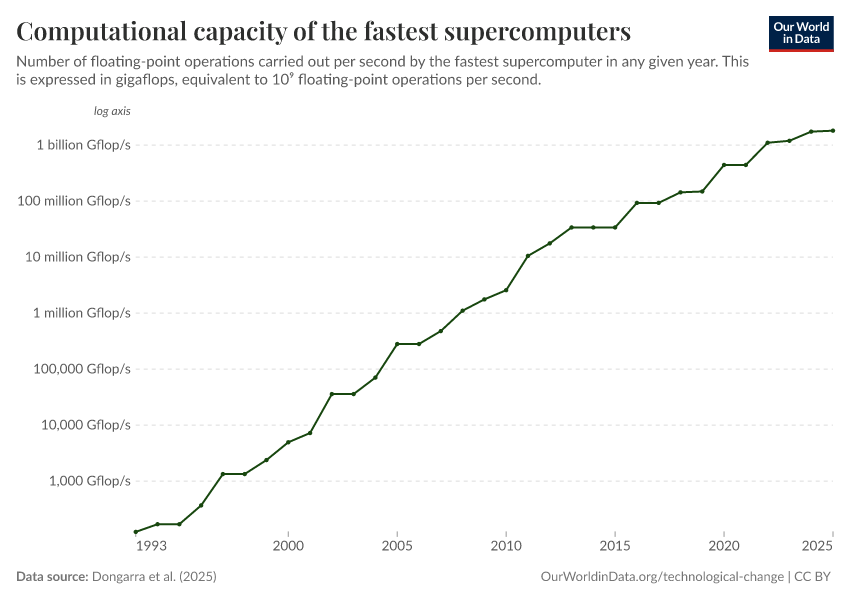
  • A thumbnail of the "Computational capacity of the fastest supercomputers" chartComputational capacity of the fastest supercomputers
  • A thumbnail of the "Cost of space launches to low Earth orbit" chartCost of space launches to low Earth orbit
  • A thumbnail of the "Cost per billion pairs of DNA sequencing" chartCost per billion pairs of DNA sequencing
  • A thumbnail of the "Global installations and operational stock of industrial robots" chartGlobal installations and operational stock of industrial robots
  • A thumbnail of the "Human visits to space per year" chartHuman visits to space per year
  • A thumbnail of the "Industrial robots in operation per 1,000 employees" chartIndustrial robots in operation per 1,000 employees
  • A thumbnail of the "Landline Internet subscriptions" chartLandline Internet subscriptions
  • A thumbnail of the "Landline Internet subscriptions per 100 people" chartLandline Internet subscriptions per 100 people
  • A thumbnail of the "Landline phone subscriptions" chartLandline phone subscriptions
  • A thumbnail of the "Landline phone subscriptions per 100 people" chartLandline phone subscriptions per 100 people
  • A thumbnail of the "Levelized cost of energy for renewables" chartLevelized cost of energy for renewables
  • A thumbnail of the "Mobile and landline phone subscriptions per 100 people" chartMobile and landline phone subscriptions per 100 people
  • A thumbnail of the "Mobile phone subscriptions" chartMobile phone subscriptions
  • A thumbnail of the "Mobile phone subscriptions per 100 people" chartMobile phone subscriptions per 100 people
  • A thumbnail of the "Monthly spending on data center construction in the United States" chartMonthly spending on data center construction in the United States
  • A thumbnail of the "NVIDIA’s quarterly revenue by market segment" chartNVIDIA’s quarterly revenue by market segment
  • A thumbnail of the "New industrial robots installed per year" chartNew industrial robots installed per year
  • A thumbnail of the "Number of people using the Internet" chartNumber of people using the Internet
  • A thumbnail of the "Price changes in consumer goods and services in the United States" chartPrice changes in consumer goods and services in the United States
  • A thumbnail of the "Projected number of air conditioning units" chartProjected number of air conditioning units
  • A thumbnail of the "Share of United States households using specific technologies" chartShare of United States households using specific technologies
  • A thumbnail of the "Share of households with air conditioning" chartShare of households with air conditioning
  • A thumbnail of the "Share of people in range of 4G mobile network" chartShare of people in range of 4G mobile network
  • A thumbnail of the "Share of people who own a mobile phone, by sex" chartShare of people who own a mobile phone, by sex
  • A thumbnail of the "Share of the population that owns a mobile phone" chartShare of the population that owns a mobile phone
  • A thumbnail of the "Share of the population within range of a 2G, 3G, 4G, or 5G mobile network" chartShare of the population within range of a 2G, 3G, 4G, or 5G mobile network
  • A thumbnail of the "Solar photovoltaic module prices vs. cumulative capacity" chartSolar photovoltaic module prices vs. cumulative capacity
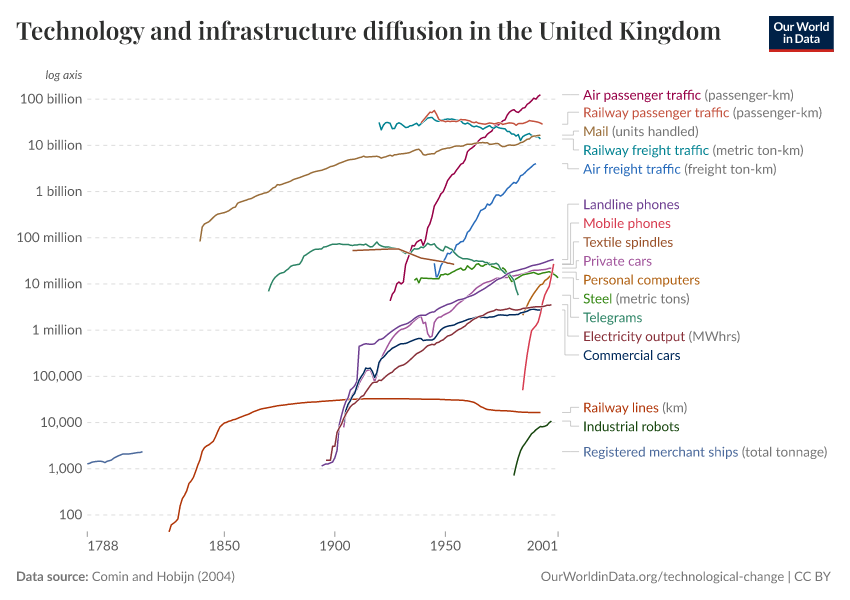
  • A thumbnail of the "Technology and infrastructure diffusion in the United Kingdom" chartTechnology and infrastructure diffusion in the United Kingdom
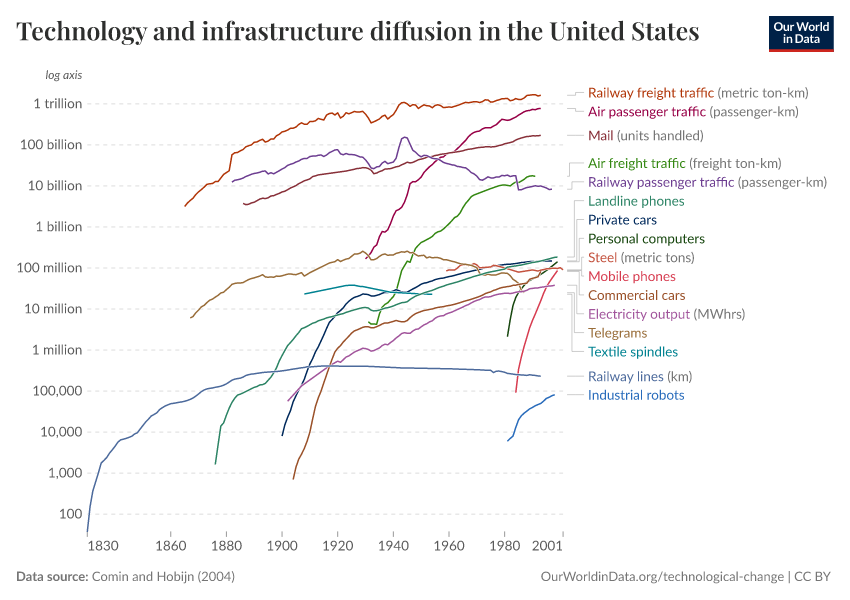
  • A thumbnail of the "Technology and infrastructure diffusion in the United States" chartTechnology and infrastructure diffusion in the United States
  • A thumbnail of the "Test scores of AI systems on various capabilities relative to human performance" chartTest scores of AI systems on various capabilities relative to human performance
  • A thumbnail of the "The cost of 66 different technologies over time" chartThe cost of 66 different technologies over time
  • A thumbnail of the "Computation used to train notable artificial intelligence systems" chartComputation used to train notable artificial intelligence systems
  • A thumbnail of the "Cumulative number of gravitational wave observations" chartCumulative number of gravitational wave observations
  • A thumbnail of the "Cumulative number of large-scale AI systems by country since 2019" chartCumulative number of large-scale AI systems by country since 2019
  • A thumbnail of the "Exponential growth of datapoints used to train notable AI systems" chartExponential growth of datapoints used to train notable AI systems
Chart 1 of 45

Cite this work

Our articles and data visualizations rely on work from many different people and organizations. When citing this topic page, please also cite the underlying data sources. This topic page can be cited as:

Max Roser, Hannah Ritchie, and Edouard Mathieu (2023) - “Technological Change” Published online at OurWorldinData.org. Retrieved from: 'https://ourworldindata.org/technological-change' [Online Resource]

BibTeX citation

@article{owid-technological-change,
    author = {Max Roser and Hannah Ritchie and Edouard Mathieu},
    title = {Technological Change},
    journal = {Our World in Data},
    year = {2023},
    note = {https://ourworldindata.org/technological-change}
}
Our World in Data logo

Reuse this work freely

All visualizations, data, and articles produced by Our World in Data are completely open access under the Creative Commons BY license. You have the permission to use, distribute, and reproduce these in any medium, provided the source and authors are credited.

The data produced by third parties and made available by Our World in Data is subject to the license terms from the original third-party authors. We will always indicate the original source of the data in our documentation, so you should always check the license of any such third-party data before use and redistribution.
All of our charts can be embedded in any site.

You are visitor 01402503 — GeezerVison does not store the pages you look up.
Best viewed with Netscape Navigator 4.7 or Internet Explorer 6 at 800×600. No cookies required.