GeezerVisonThe World Wide Web, restored to 800 pixels of glory. |
| Home|About|Gaming cabinet|Archives|How it works|Starter sites |
GeezerVison is showing plotly.com — Jupyter notebook tutorial in Python Introduction¶Jupyter has a beautiful notebook that lets you write and execute code, analyze data, embed content, and share reproducible work. Jupyter Notebook (previously referred to as IPython Notebook) allows you to easily share your code, data, plots, and explanation in a sinle notebook. Publishing is flexible: PDF, HTML, ipynb, dashboards, slides, and more. Code cells are based on an input and output format. For example: In [1]:
print("hello world") hello world Installation¶There are a few ways to use a Jupyter Notebook:
Getting Started¶Once you've installed the Notebook, you start from your terminal by calling Helpful Commands¶- Tab Completion: Jupyter supports tab completion! You can type In [2]:
help
Out[2]:
Type help() for interactive help, or help(object) for help about object. - Quick Reference: open quick reference by running: In [3]:
quickref
- Keyboard Shortcuts: Languages¶The bulk of this tutorial discusses executing python code in Jupyter notebooks. You can also use Jupyter notebooks to execute R code. Skip down to the [R section] for more information on using IRkernel with Jupyter notebooks and graphing examples. Package Management¶When installing packages in Jupyter, you either need to install the package in your actual shell, or run the You may want to reload submodules if you've edited the code in one. IPython comes with automatic reloading magic. You can reload all changed modules before executing a new line. Some useful packages that we'll use in this tutorial include:
In [4]:
import pandas as pd
import numpy as np
import scipy as sp
import chart_studio.plotly as py
Import Data¶You can use pandas In [5]:
import chart_studio.plotly as py
import plotly.figure_factory as ff
import pandas as pd

df = pd.read_csv("https://raw.githubusercontent.com/plotly/datasets/master/school_earnings.csv")

table = ff.create_table(df)
py.iplot(table, filename='jupyter-table1')
Out[5]:
Use In [6]:
schools = df.School
schools[0]
Out[6]:
'MIT' Most pandas functions also work on an entire dataframe. For example, calling In [7]:
df.std() Out[7]:
Women    12.813683
Men      25.705289
Gap      14.137084
dtype: float64
Plotting Inline¶You can use Plotly's python API to plot inside your Jupyter Notebook by calling In [8]:
import chart_studio.plotly as py
import plotly.graph_objects as go

data = [go.Bar(x=df.School,
            y=df.Gap)]

py.iplot(data, filename='jupyter-basic_bar')
Out[8]:
Plotting multiple traces and styling the chart with custom colors and titles is simple with Plotly syntax. Additionally, you can control the privacy with In [9]:
import chart_studio.plotly as py
import plotly.graph_objects as go

trace_women = go.Bar(x=df.School,
                  y=df.Women,
                  name='Women',
                  marker=dict(color='#ffcdd2'))

trace_men = go.Bar(x=df.School,
                y=df.Men,
                name='Men',
                marker=dict(color='#A2D5F2'))

trace_gap = go.Bar(x=df.School,
                y=df.Gap,
                name='Gap',
                marker=dict(color='#59606D'))

data = [trace_women, trace_men, trace_gap]

layout = go.Layout(title="Average Earnings for Graduates",
                xaxis=dict(title='School'),
                yaxis=dict(title='Salary (in thousands)'))

fig = go.Figure(data=data, layout=layout)

py.iplot(fig, sharing='private', filename='jupyter-styled_bar')
Out[9]:
Now we have interactive charts displayed in our notebook. Hover on the chart to see the values for each bar, click and drag to zoom into a specific section or click on the legend to hide/show a trace. Plotting Interactive Maps¶Plotly is now integrated with Mapbox. In this example we'll plot lattitude and longitude data of nuclear waste sites. To plot on Mapbox maps with Plotly you'll need a Mapbox account and a Mapbox Access Token which you can add to your Plotly settings. In [10]:
import chart_studio.plotly as py
import plotly.graph_objects as go

import pandas as pd

# mapbox_access_token = 'ADD YOUR TOKEN HERE'

df = pd.read_csv('https://raw.githubusercontent.com/plotly/datasets/master/Nuclear%20Waste%20Sites%20on%20American%20Campuses.csv')
site_lat = df.lat
site_lon = df.lon
locations_name = df.text

data = [
    go.Scattermapbox(
        lat=site_lat,
        lon=site_lon,
        mode='markers',
        marker=dict(
            size=17,
            color='rgb(255, 0, 0)',
            opacity=0.7
        ),
        text=locations_name,
        hoverinfo='text'
    ),
    go.Scattermapbox(
        lat=site_lat,
        lon=site_lon,
        mode='markers',
        marker=dict(
            size=8,
            color='rgb(242, 177, 172)',
            opacity=0.7
        ),
        hoverinfo='none'
    )]


layout = go.Layout(
    title='Nuclear Waste Sites on Campus',
    autosize=True,
    hovermode='closest',
    showlegend=False,
    mapbox=dict(
        accesstoken=mapbox_access_token,
        bearing=0,
        center=dict(
            lat=38,
            lon=-94
        ),
        pitch=0,
        zoom=3,
        style='light'
    ),
)

fig = dict(data=data, layout=layout)

py.iplot(fig, filename='jupyter-Nuclear Waste Sites on American Campuses')
Out[10]:
In [11]:
import chart_studio.plotly as py
import plotly.graph_objects as go

import numpy as np

s = np.linspace(0, 2 * np.pi, 240)
t = np.linspace(0, np.pi, 240)
tGrid, sGrid = np.meshgrid(s, t)

r = 2 + np.sin(7 * sGrid + 5 * tGrid)  # r = 2 + sin(7s+5t)
x = r * np.cos(sGrid) * np.sin(tGrid)  # x = r*cos(s)*sin(t)
y = r * np.sin(sGrid) * np.sin(tGrid)  # y = r*sin(s)*sin(t)
z = r * np.cos(tGrid)                  # z = r*cos(t)

surface = go.Surface(x=x, y=y, z=z)
data = [surface]

layout = go.Layout(
    title='Parametric Plot',
    scene=dict(
        xaxis=dict(
            gridcolor='rgb(255, 255, 255)',
            zerolinecolor='rgb(255, 255, 255)',
            showbackground=True,
            backgroundcolor='rgb(230, 230,230)'
        ),
        yaxis=dict(
            gridcolor='rgb(255, 255, 255)',
            zerolinecolor='rgb(255, 255, 255)',
            showbackground=True,
            backgroundcolor='rgb(230, 230,230)'
        ),
        zaxis=dict(
            gridcolor='rgb(255, 255, 255)',
            zerolinecolor='rgb(255, 255, 255)',
            showbackground=True,
            backgroundcolor='rgb(230, 230,230)'
        )
    )
)

fig = go.Figure(data=data, layout=layout)
py.iplot(fig, filename='jupyter-parametric_plot')
Out[11]:
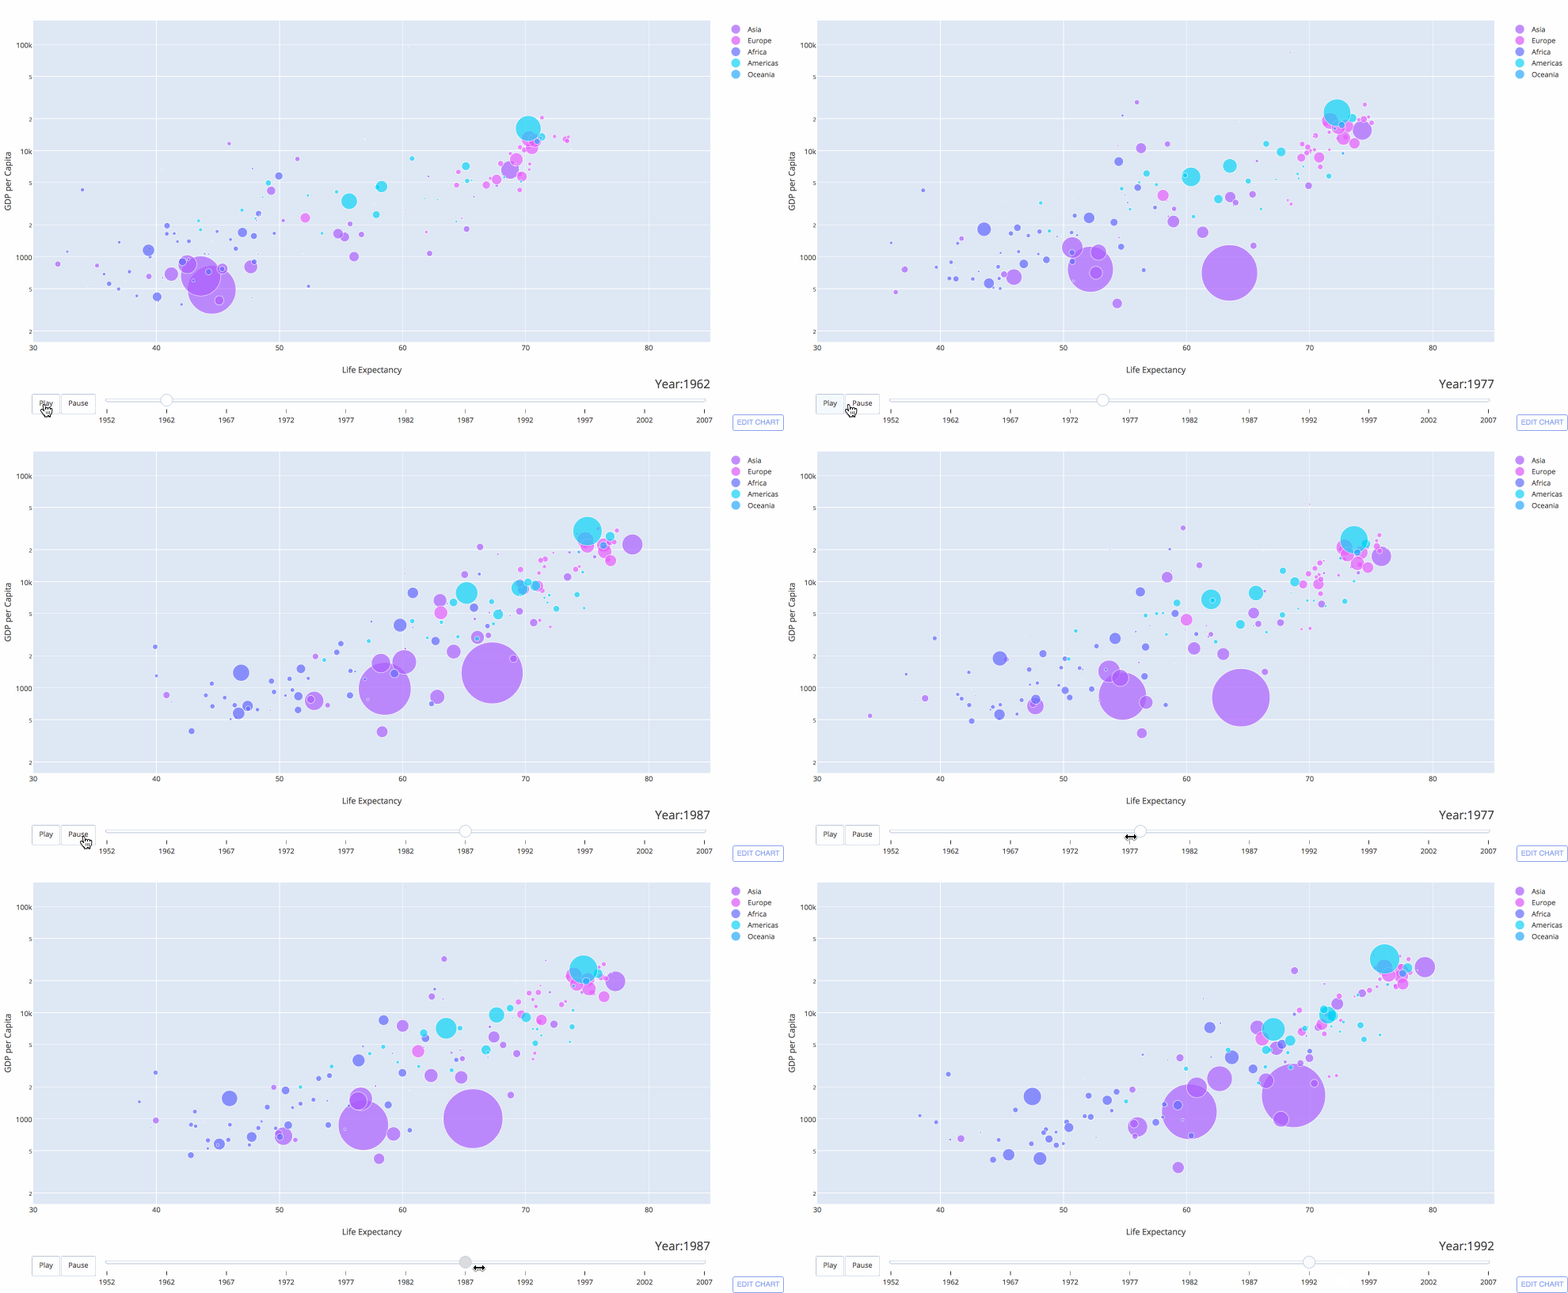
Animated Plots¶Checkout Plotly's animation documentation to see how to create animated plots inline in Jupyter notebooks like the Gapminder plot displayed below:
Plot Controls & IPython widgets¶Add sliders, buttons, and dropdowns to your inline chart: In [12]:
import chart_studio.plotly as py
import numpy as np

data = [dict(
        visible = False,
        line=dict(color='#00CED1', width=6),
        name = '𝜈 = '+str(step),
        x = np.arange(0,10,0.01),
        y = np.sin(step*np.arange(0,10,0.01))) for step in np.arange(0,5,0.1)]
data[10]['visible'] = True

steps = []
for i in range(len(data)):
    step = dict(
        method = 'restyle',
        args = ['visible', [False] * len(data)],
    )
    step['args'][1][i] = True # Toggle i'th trace to "visible"
    steps.append(step)

sliders = [dict(
    active = 10,
    currentvalue = {"prefix": "Frequency: "},
    pad = {"t": 50},
    steps = steps
)]

layout = dict(sliders=sliders)
fig = dict(data=data, layout=layout)

py.iplot(fig, filename='Sine Wave Slider')
Out[12]:
Additionally, IPython widgets allow you to add sliders, widgets, search boxes, and more to your Notebook. See the widget docs for more information. For others to be able to access your work, they'll need IPython. Or, you can use a cloud-based NB option so others can run your work.
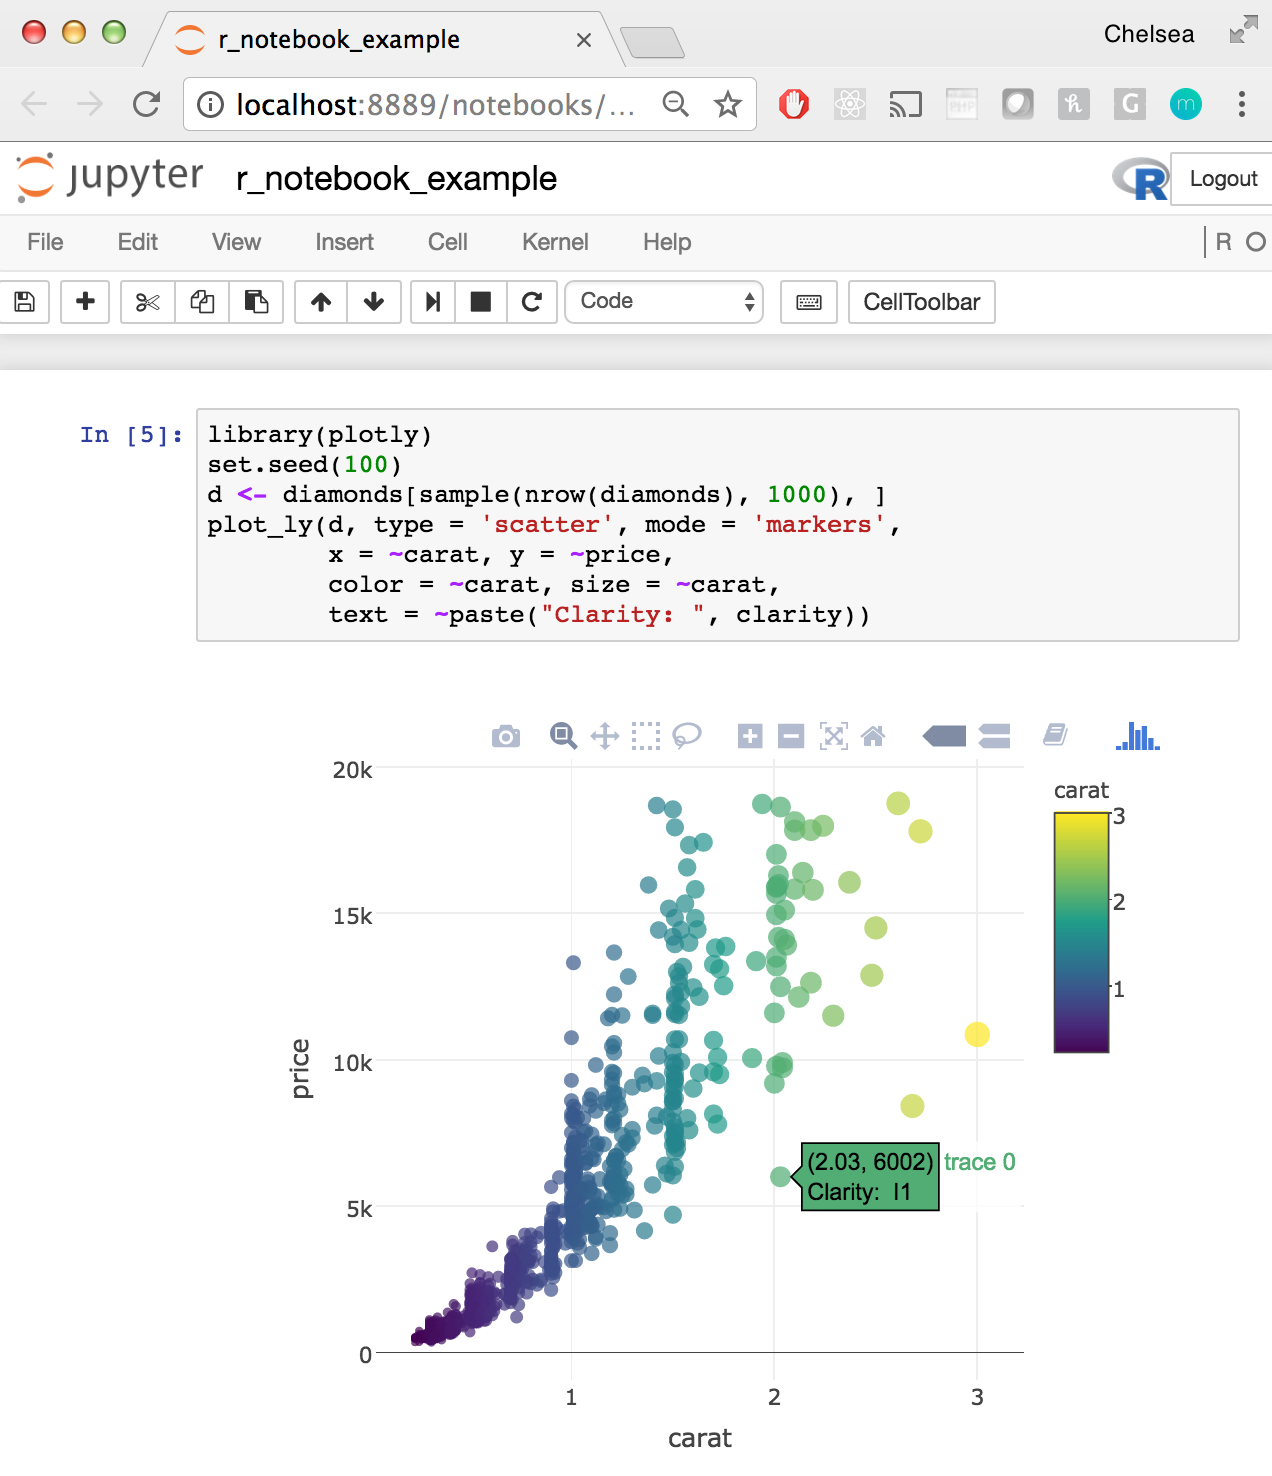
Executing R Code¶IRkernel, an R kernel for Jupyter, allows you to write and execute R code in a Jupyter notebook. Checkout the IRkernel documentation for some simple installation instructions. Once IRkernel is installed, open a Jupyter Notebook by calling
See a full R example Jupyter Notebook here: https://plotly.com/~chelsea_lyn/14069 Additional Embed Features¶We've seen how to embed Plotly tables and charts as iframes in the notebook, with In [13]:
from IPython.display import YouTubeVideo
YouTubeVideo("wupToqz1e2g")
Out[13]:
LaTeX¶We can embed LaTeX inside a Notebook by putting a $$c = \sqrt{a^2 + b^2}$$ Or, you can display output from Python, as seen here. In [14]:
from IPython.display import display, Math, Latex

display(Math(r'F(k) = \int_{-\infty}^{\infty} f(x) e^{2\pi i k} dx'))
$\displaystyle F(k) = \int_{-\infty}^{\infty} f(x) e^{2\pi i k} dx$
Exporting & Publishing Notebooks¶We can export the Notebook as an HTML, PDF, .py, .ipynb, Markdown, and reST file. You can also turn your NB into a slideshow. You can publish Jupyter Notebooks on Plotly. Simply visit plot.ly and select the Publishing Dashboards¶Users publishing interactive graphs can also use Plotly's dashboarding tool to arrange plots with a drag and drop interface. These dashboards can be published, embedded, and shared. Jupyter Gallery¶For more Jupyter tutorials, checkout Plotly's python documentation: all documentation is written in jupyter notebooks that you can download and run yourself or checkout these user submitted examples!

|
| You are visitor 01402503 — GeezerVison does not store the pages you look up. Best viewed with Netscape Navigator 4.7 or Internet Explorer 6 at 800×600. No cookies required. |