GeezerVisonThe World Wide Web, restored to 800 pixels of glory. |
| Home|About|Gaming cabinet|Archives|How it works|Starter sites |
GeezerVison is showing python-graph-gallery.com — Best Python Chart Examples Best Python Chart ExamplesThe Python Graph Gallery has always been a reservoir of inspiration, providing hundreds of foundational chart examples for newcomers and seasoned developers alike. While our vast collection offers a stepping stone into the world of data visualization, the following list stands out. Every chart here represents the pinnacle of craftsmanship, exhibiting the depths to which matplotlib can be customized. These are not just graphs; they are polished masterpieces, ready for publication. While I'm deeply indebted to the original authors for their stellar work, it's worth noting that many of these visualizations were first conceived in R, a testament to its rich visualization ecosystem. In an endeavor to bring the best to our Python community, I've translated these gems to further showcase the versatility and power of matplotlib. Dive in and get inspired! 😍 Love Python and Dataviz? I send my best tips once a week in my "Dataviz Universe" newsletter. More than 8000 people love it!  Salary evolutionMinimalist black and white line chart about the salary evolution of a freelance data scientist by Joseph Barbier Read tutorial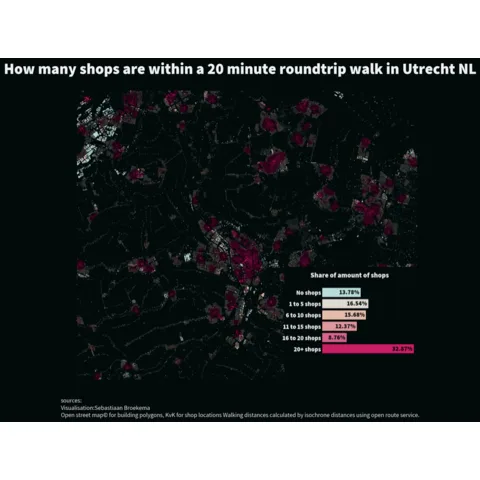 Beyond the choropleth: a polygon mapNumber of shops within a 20-minute round-trip walk by Sebastiaan Broekema Read tutorial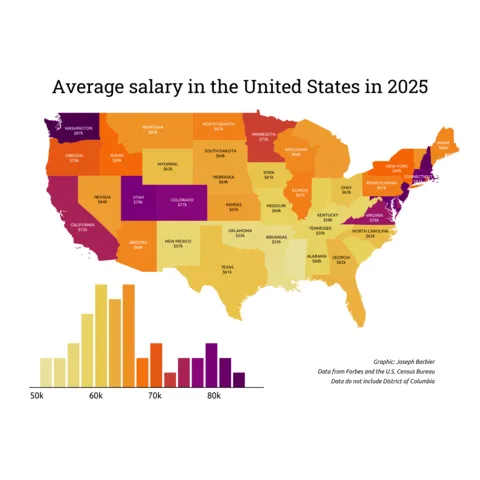 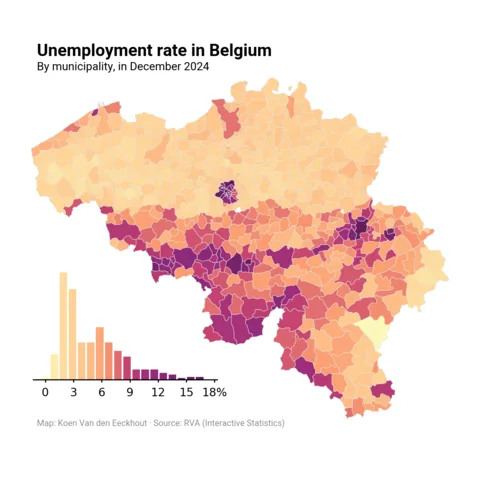 Unemployment rate in BelgiumBreakdown and distribution of the unemployment rate in Belgium by Koen Van den Eeckhout Read tutorial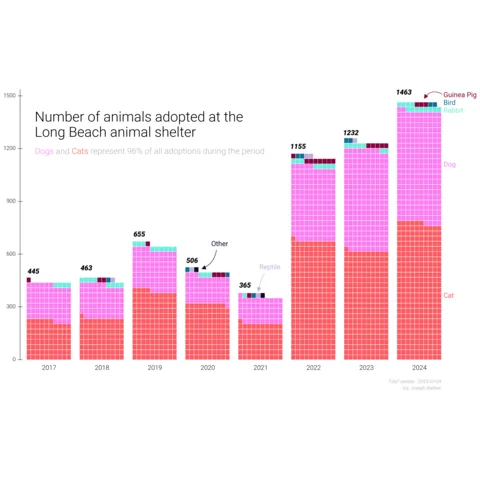 Animal adoption evolutionWaffle chart about animal adoption evolution between 2017 and 2024. by Joseph Barbier Read tutorial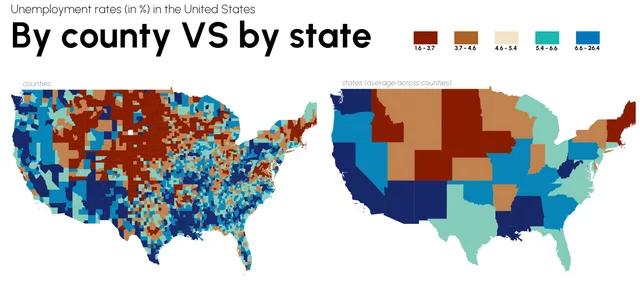 Unemployment rates in the USCombine two choropleth maps with different granularities by Joseph Barbier Read tutorial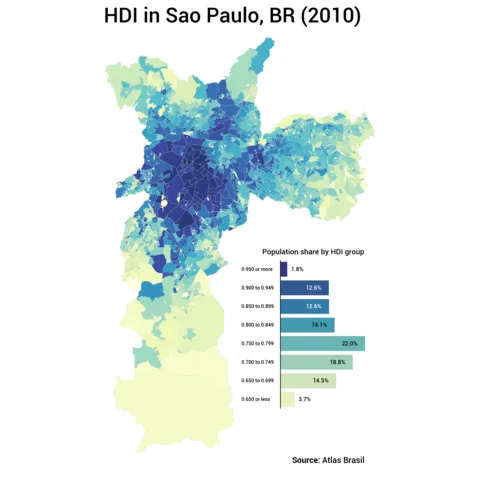  Evolution of temperature variationTemperature change compared to the average between 1951 and 1980. by Joseph Barbier Read tutorial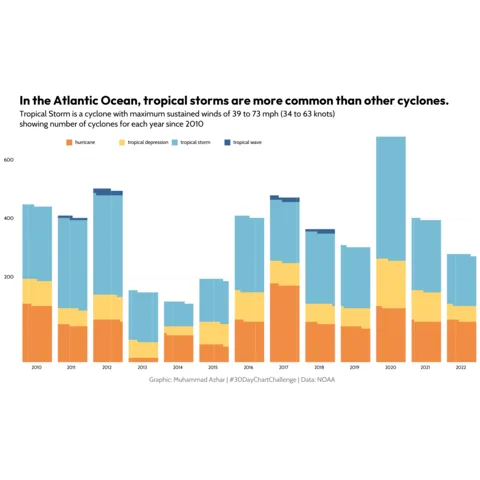 Share of cereals used as animal feedsChange in the number of storms by storm type between 2010 and 2022. by Muhammad Azhar Read tutorial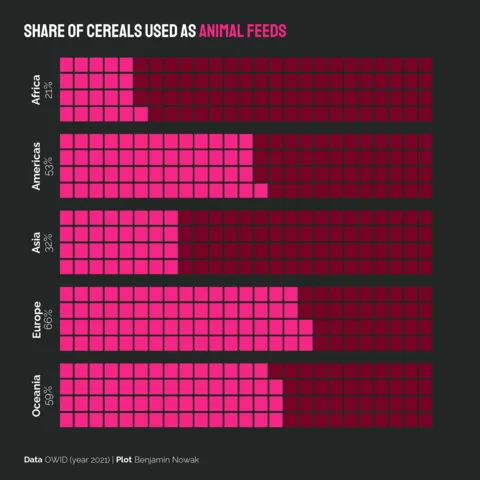 Share of cereals used as animal feedsBreakdown by continent of the percentage of cereals used for animal feed. by Benjamin Nowak Read tutorial Japan's population evolutionEvolution of Japan's population between 1952 and 2024. by Joseph Barbier Read tutorial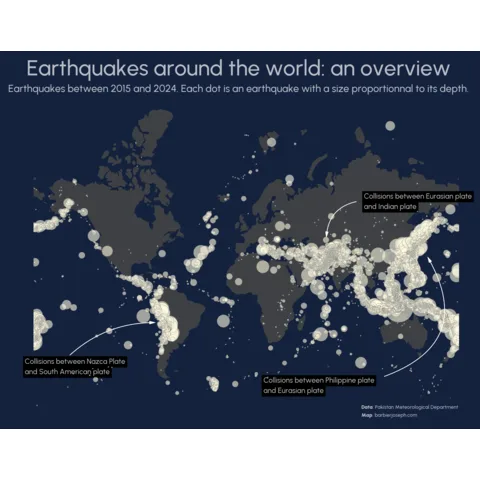 Earthquakes around the worldRepartition of earthquakes around the world, with description of extensive description and annotations. by Joseph Barbier Read tutorial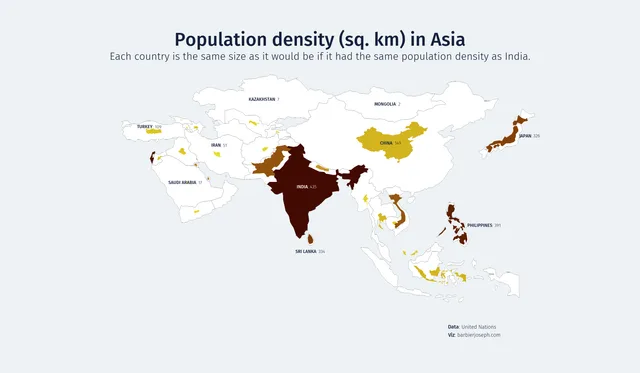 Density population in AsiaCartogram (non-contiguous) of population density in Asia. by Joseph Barbier Read tutorial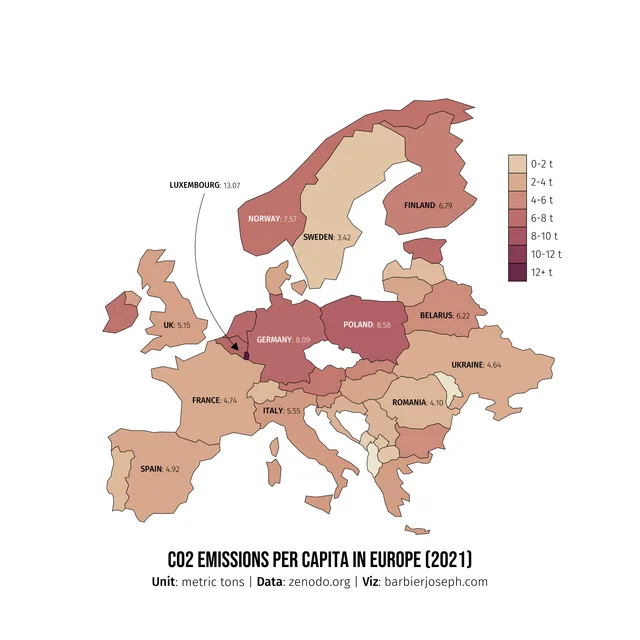 CO2 consumption in EuropeChoropleth map of CO2 consumption per capita in Europe, with a custom legend. by Joseph Barbier Read tutorial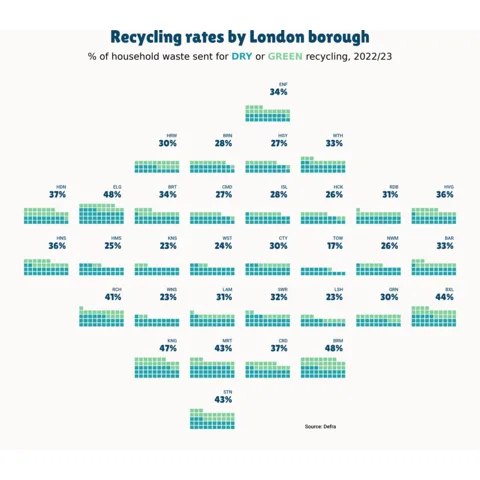 London recycling ratesRepartition of London recycling rates by boroughs, with small multiples of waffle charts. by Lisa Hornung Read tutorial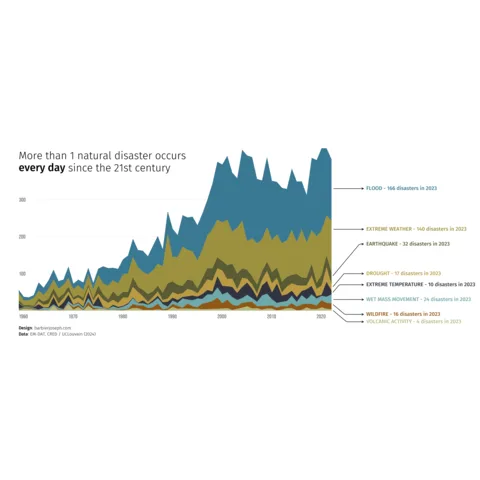 Evolution of natural disastersNumber of natural disasters over time per disaster type, with inflexion arrows for the legend. by Joseph Barbier Read tutorial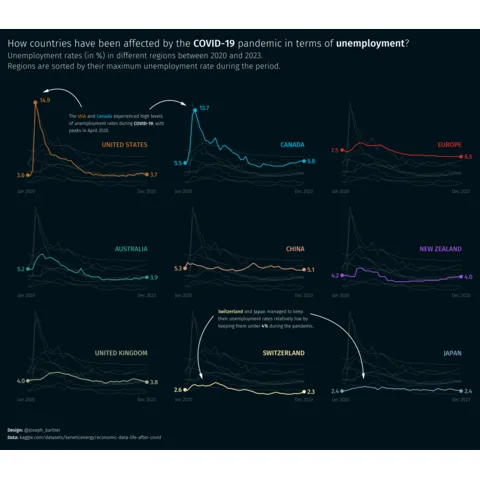 Unemployment rate during COVID-19Evolution of unemployment rates between different regions across the world during the COVID-19 pandemic. by Joseph Barbier Read tutorial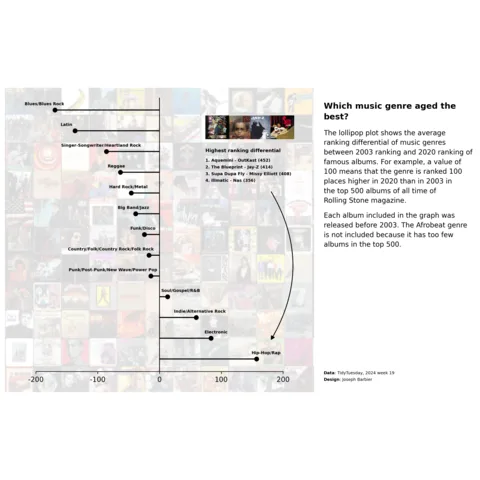 Lollipop about music genresA lollipop plot with a background image to visualize the popularity of music genres over time. by Joseph Barbier Read tutorial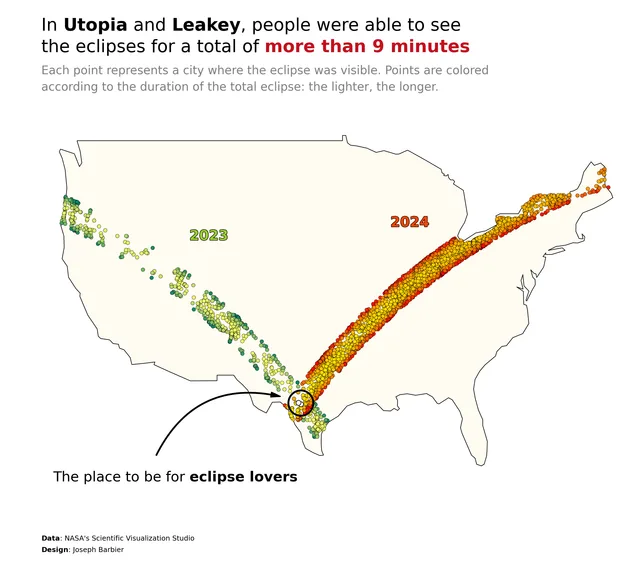 Map with scatter plot on topPath and duration of solar eclipses in the USA, in 2023 and 2024. by Joseph Barbier Read tutorial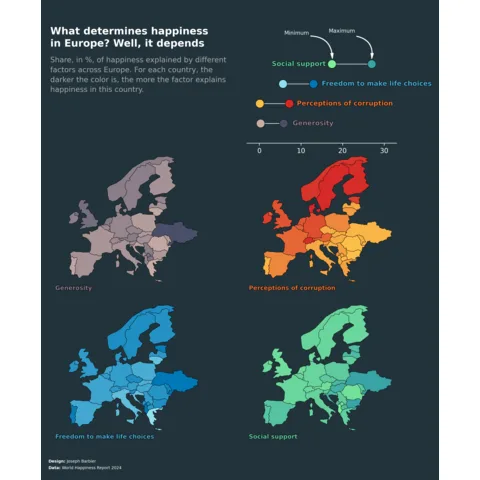 Multiple choropleth mapCombine multiple maps about happiness together, with a lollipop plot for the legend. by Joseph Barbier Read tutorial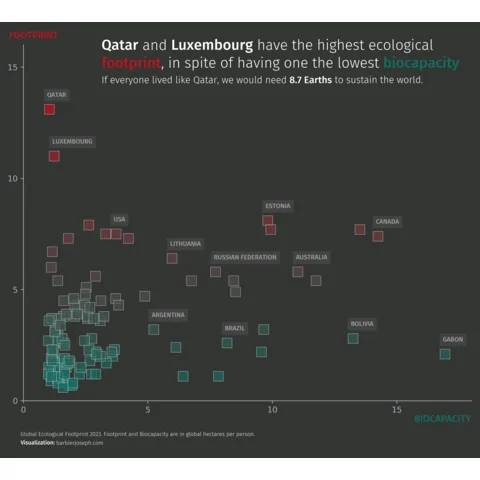 Scatter plot with specific highlightsRelationship between footprint and biocapacity of countries, with specific highlights on some countries. by Joseph Barbier Read tutorial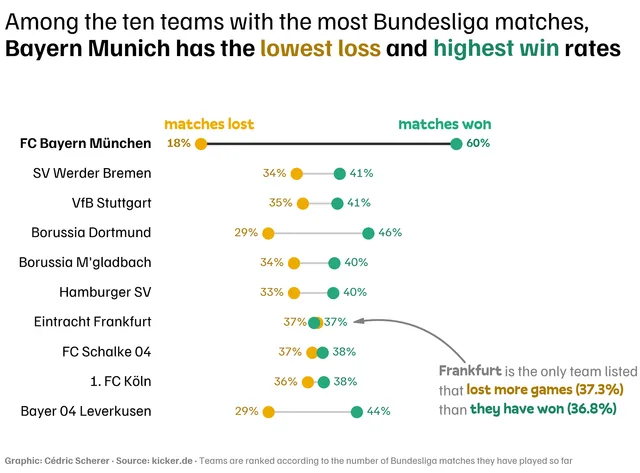 Dumbell chartAdvanced dumbell chart about wins and losses in the Bundesliga. by Cédric Scherer Read tutorial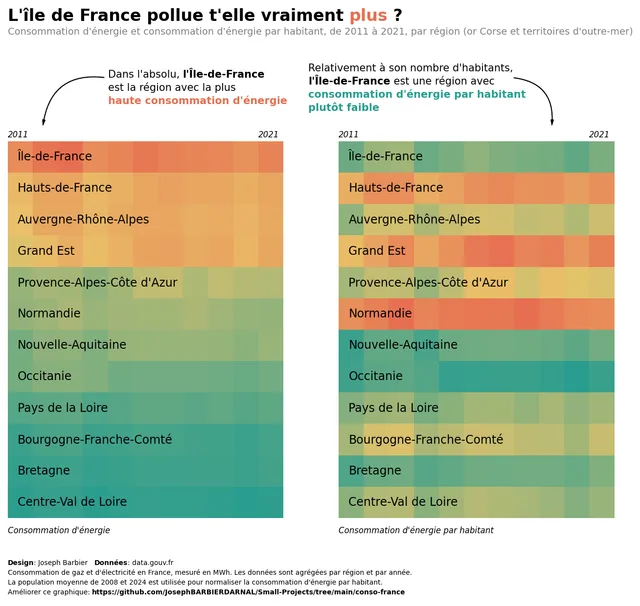 Double heatmap for comparisonA double heatmap to compare normalized and non-normalized data about energy consumption in France by Joseph Barbier Read tutorial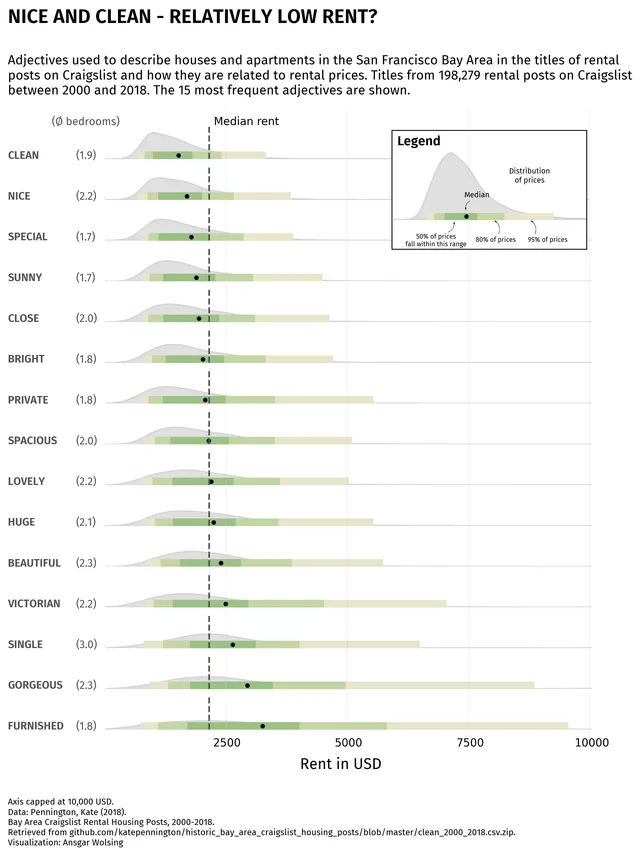 Ridgeline with quantiles displayA ridgeline plot with quantiles and annotations to visualize the price distribution of rents in San Francisco. by Ansgar Wolsing Read tutorial Polished table with bubblesInvestigating the 10 best and worst countries to live in, with bubble in cells to represent the data. A good way to showcase the plottable library. by Fortune Uwha Read tutorial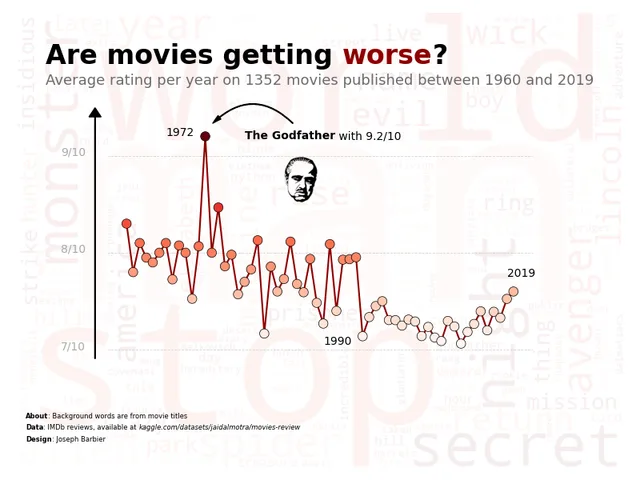 Line chart with word cloudMovie titles in the background of a line chart to visualize average ratings over time. by Joseph Barbier Read tutorial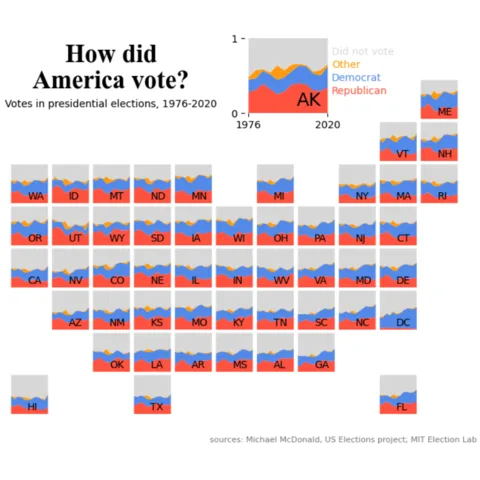 Mini stacked areas for US statesThis compendium of stacked area charts went viral. Read a translation in python of this work by Enrin, originally written in R. by Erin Read tutorial Choropleth map with gradient colorA choropleth map with a gradient color scale to visualize the number of people with cancer in European countries. by Joseph Barbier Read tutorial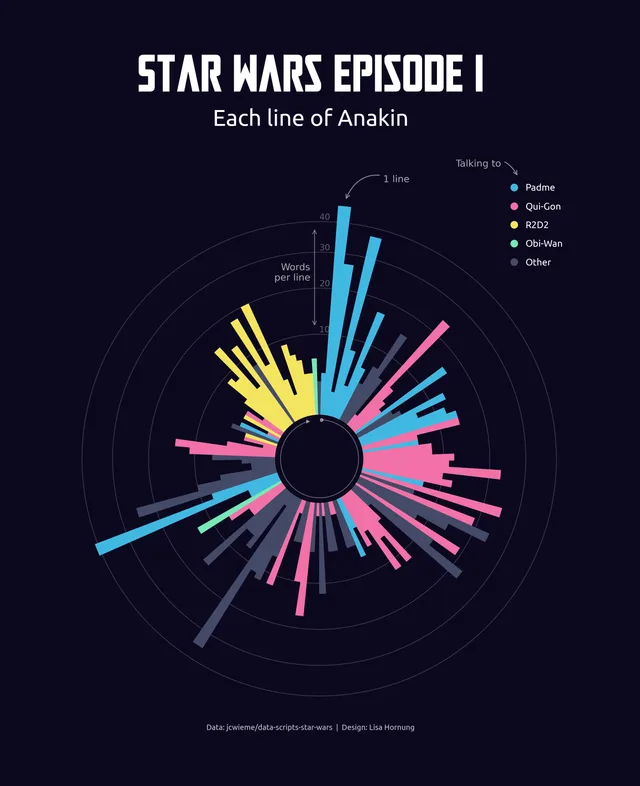 Ordered & Mirrored barplotA highly customized circular barplot visualizing Star Wars data using Python and Matplotlib. It provides a step-by-step guide from a basic barplot to a fully customized version including fonts, y-axis scaling, annotations and legend. by Lisa Hornung Read tutorial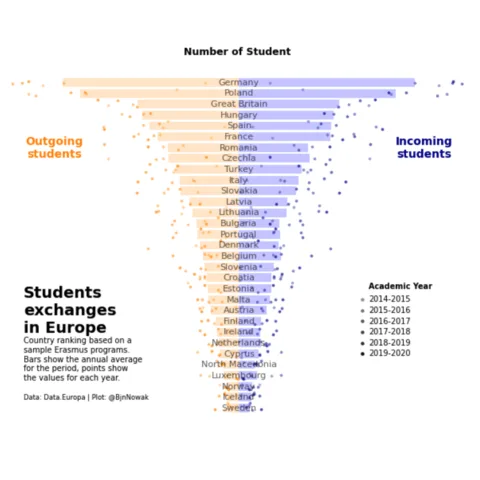 Ordered & Mirrored barplotA mirror barplot with individual observations using the Matplotlib library to visualize data about the Erasmus Program in European countries. by Benjamin Nowak Read tutorial Scatterplot with grouping, highlighting and annotationA scatter plot with custom annotations and colors, with some markers being circled. by Data Wrapper Read tutorial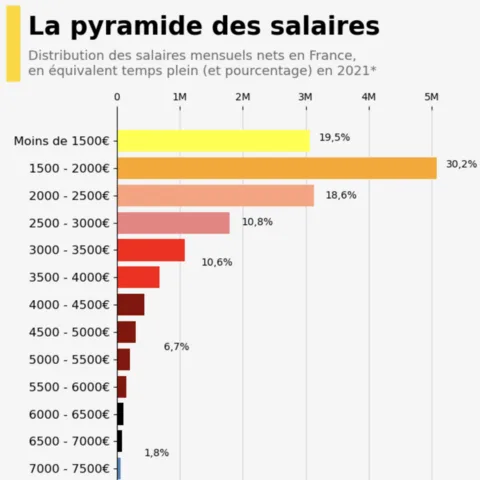 Histogram with clean color scale and annotationA clean and insightful histogram produced by the french institute of statistics showing the salary distribution in the country. by INSEE Read tutorial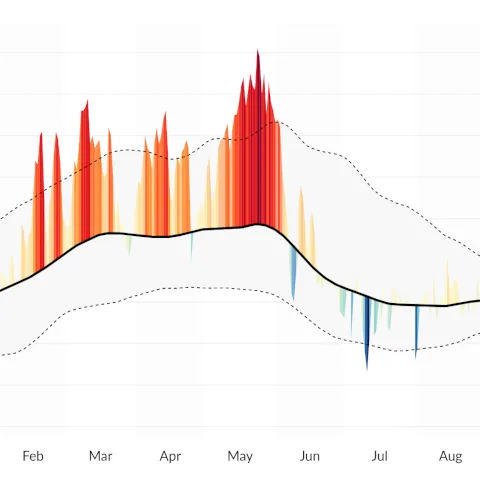 Area over flexible baseline chartAn area over a flexible baseline to show deviations from a reference or baseline made with Python and Matplotlib or Plotly. by J. Kühn Read tutorial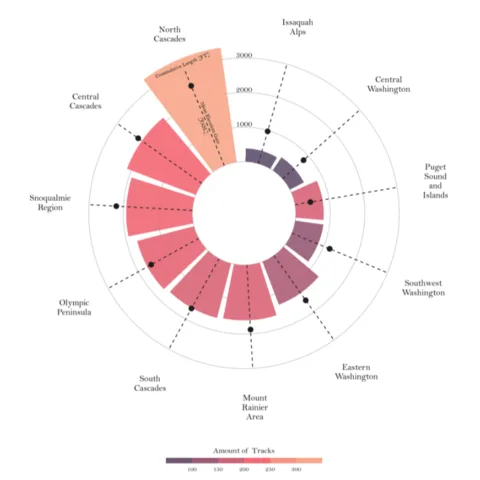 Circular BarplotA circular barchart with several features per group made with Python and Matplotlib by T. Stadler Read tutorial Circular Lollipop PlotA circular lollipop plot with customized layout, great color palette and in circle legend by C. Scherer Read tutorial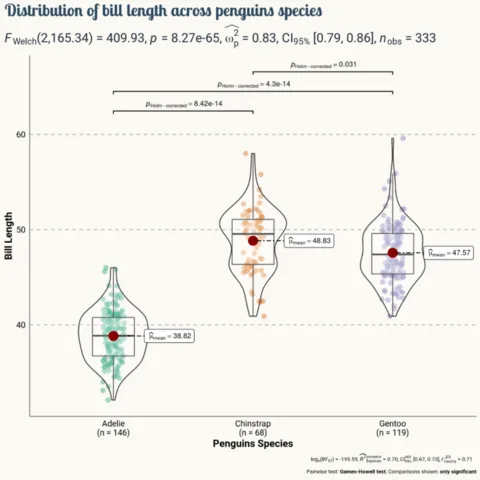 Violin and Boxplot combinationAllows the comparison of several groups with statistical test results on top by T. Wang Read tutorial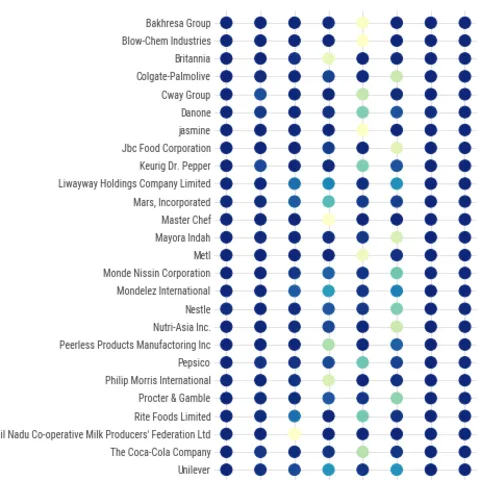 Circle HeatmapA heatmap where each cell is filled by a circle with varying size by M. Siple Read tutorial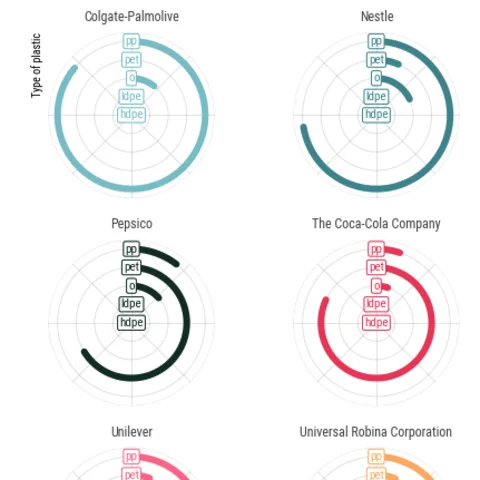 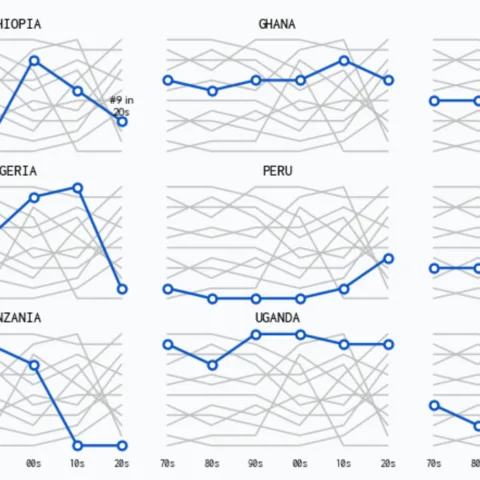 Line chart with facetingSeveral highlighted lineplots arranged in a multi panel layout to explore the evolution of the water source installation rankings by country by A. Madjid Read tutorial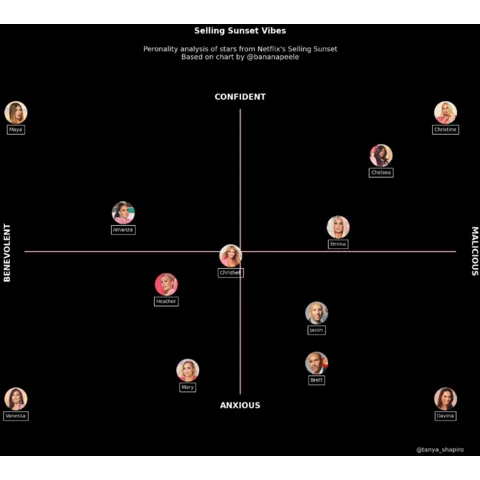 Scatterplot with imagesA scatter plot with images inside each marker to provide additional context by Tanya Shapiro Read tutorial Horizontal BarplotA reproduction of an horizontal barplot made by The Economist to showcase the power of Python for dataviz by The Economist Read tutorial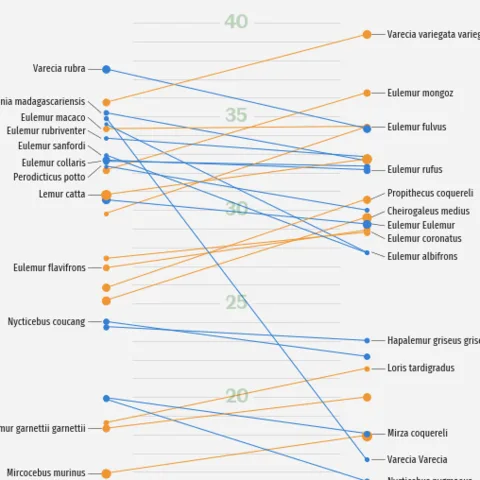 Parallel chartA parallel coordinate chart to explore the maximum ages recorded for different species of lemurs with Python and Matplotlib. by G. Karamanis Read tutorial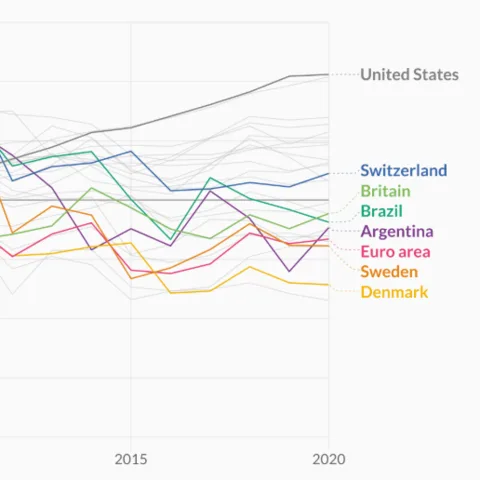 Inline labelsGood looking line chart with inline labels at the end of each line by C. Scherer Read tutorial Line chart from the EconomistMimicking the style of the Economist to get a clean line chart by The Economist Read tutorial Area chart from the EconomistMimicking the style of the Economist to get a clean area chart by The Economist Read tutorial Lollipop chartA highly customized lollipop chart showing world records for the Mario Kart 64 racing game on the Nintendo 64 by C. Scherer Read tutorial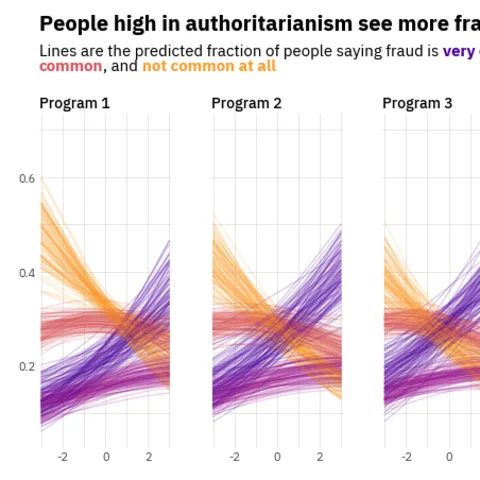 Line chart with small multipleA line chart with several groups per panel on a small multiple layout. With a beautiful color palette. by O. Medina Read tutorial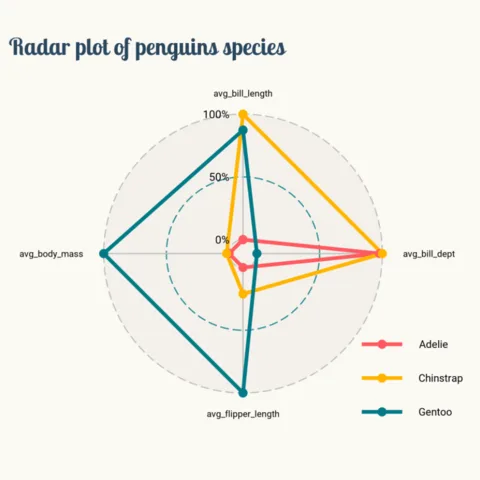 Radar chart with matplotlibA highly customized radar chart with custom annotations and labels to explore the palmerpenguins dataset made with Python and Matplotlib. by T. Wang Read tutorial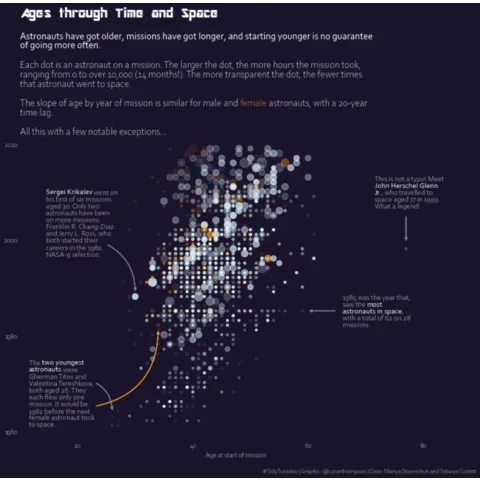 Astronaut ScatterplotA chart made of a scatterplot with variable color, shape, and opacity, and several annotations to explore the relationship between the characteristics of astronauts and space missions by C. Thompson Read tutorial Scatterplot with regression fitA custom scatterplot with an overlayed regression fit and auto-positioned labels to explore the relationship between the Corruption Perceptions Index and Human Development Index by C. O. Wilke Read tutorial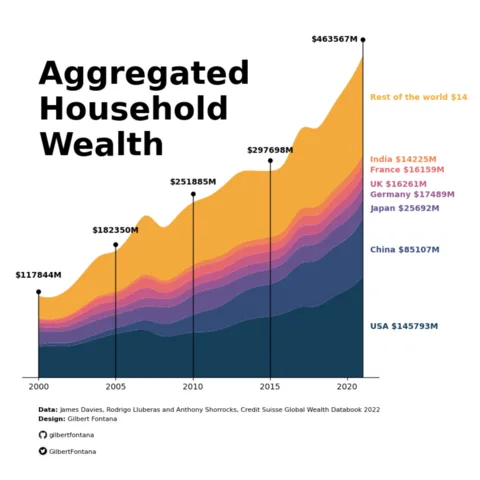 Stacked barchartA clean stacked barplot with nice color palette, some very clean inline labels, a powerful title and slick footer caption with logos. by G. Fontana Read tutorial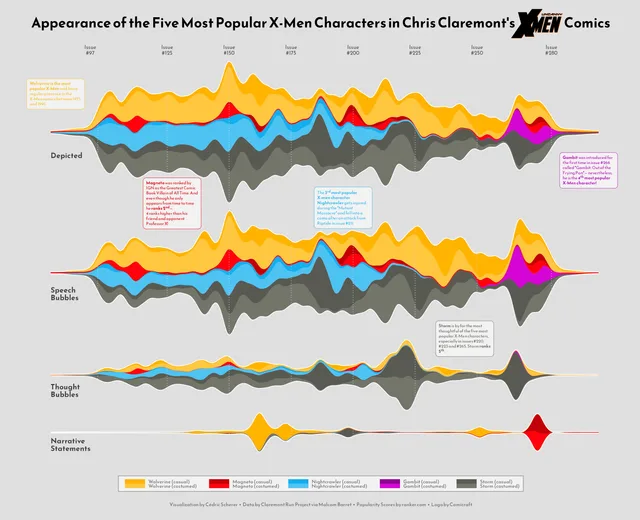 X-men StreamchartA streamchart to explore the appearances of the most popular characters in Chris Claremont's X-Men comics with Python by C. Scherer Read tutorial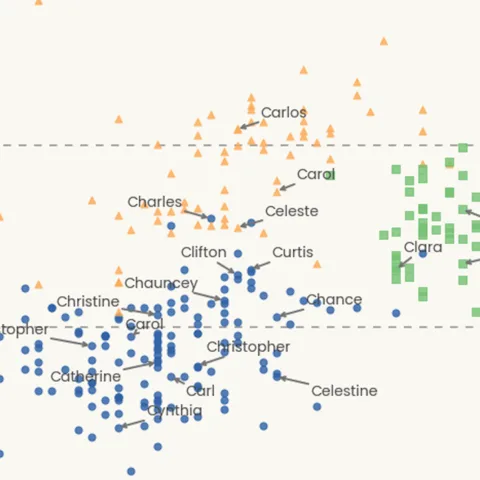 Scatterplot with text repelA custom scatterplot with auto-positioned labels to explore the palmerpenguins dataset made with Python and Matplotlib by T. Wang Read tutorial Timeseries and facetingMultiple lineplots with filled areas with a customized layout to explore the evolution of animal rescues across different boroughs in London by G. Karamanis Read tutorial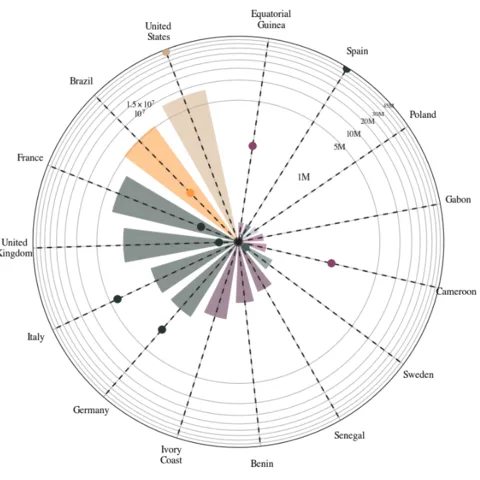 Polar bar chartA polar bar chart showing the number of spanish speakers per country by nyx-it-up Read tutorial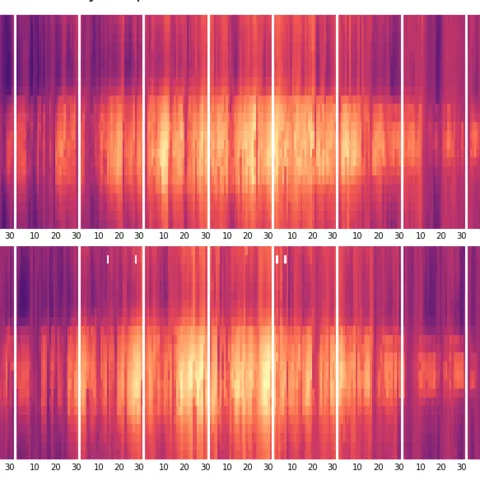 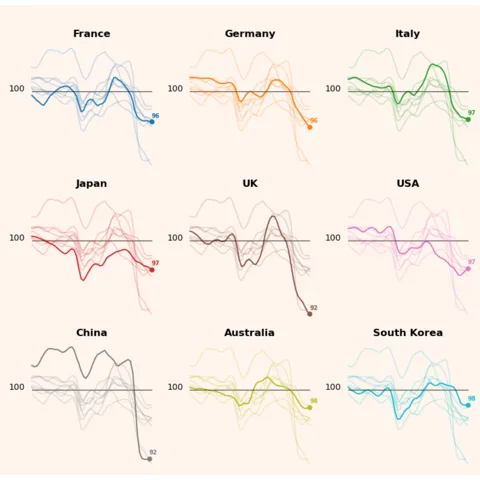 Line chart & small multipleSmall multiple is a dataviz technique allowing to study several groups on the same figure. Repeating all groups but faded out adds some useful context to each section. by G. Fontana Read tutorial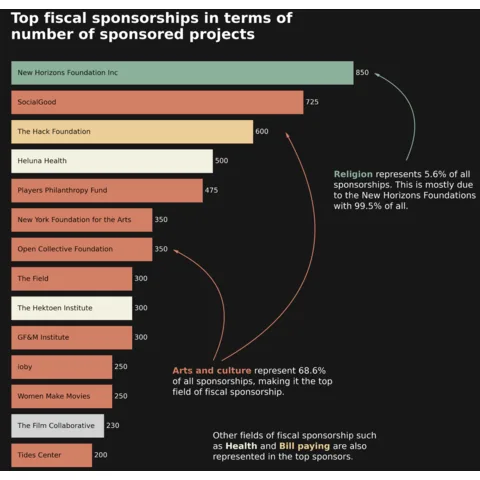 Barplot with annotations and arrowsA barplot with annotations and arrows to highlight the most important features of the data by J. Barbier Read tutorialNote that I am always hunting for the best charts made with Python! If you have any examples in mind that should be showcased here, please let me know 🙏.  If you like those examples, you will love Matplotlib Journey. It's an interactive online course crafted to transform you into a Matplotlib dataviz expert. It provides a clear, big-picture understanding of how data visualization works in Python, empowering you to grasp any example from the gallery with ease. Finally, Understand Matplotlib.300 projects 💡 Out of dataviz inspiration?I have spent years collecting the most beautiful data visualizations out there. Get the list of my top 300 dataviz projects, hand-picked, for free. I respect your privacy. Unsubscribe anytime. |
| You are visitor 01402503 — GeezerVison does not store the pages you look up. Best viewed with Netscape Navigator 4.7 or Internet Explorer 6 at 800×600. No cookies required. |