GeezerVisonThe World Wide Web, restored to 800 pixels of glory. |
| Home|About|Gaming cabinet|Archives|How it works|Starter sites |
GeezerVison is showing python-graph-gallery.com — Python Graph Gallery The Python Graph GalleryA collection of hundreds of charts made with 💡 Chart classification follows the The biggest list of python chart examplesCharts are classified by chart type. Each section starts with a foundational tutorial, then goes into the most common customizations. General KnowledgeHunting the most beautiful Python chartsExplore our curated collection of the finest Python charts, handpicked for their superior design and accuracy. Go beyond the defaults with chart examples that are both visually stunning and instructive. Accompanied by in-depth tutorials, this section will please seasoned professionals aspiring to elevate their craft. Featuring the finest charts on the web, we stay ahead of the curve, showcasing the latest tips, tricks, and advanced techniques in data visualization.  Salary evolution Joseph Barbier 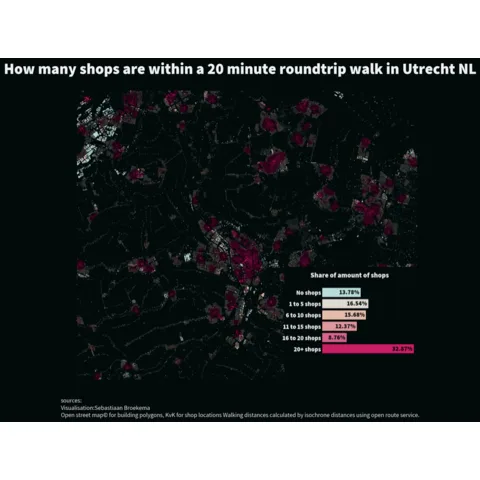 Beyond the choropleth: a polygon map Sebastiaan Broekema 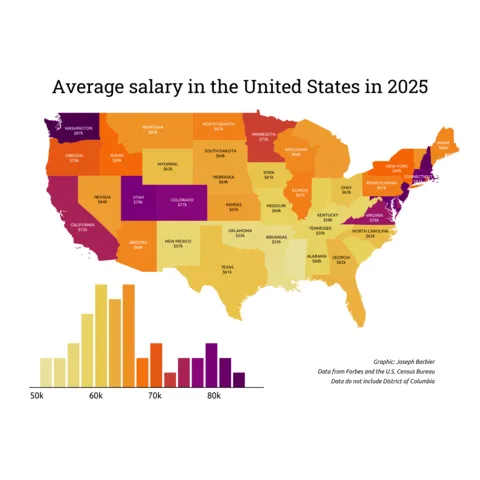 Salary in the USA Joseph Barbier 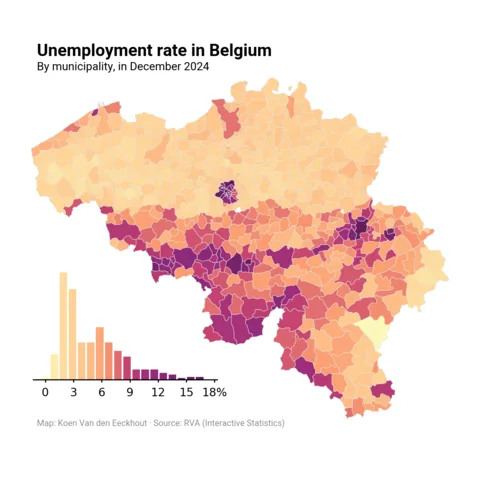 Unemployment rate in Belgium Koen Van den Eeckhout 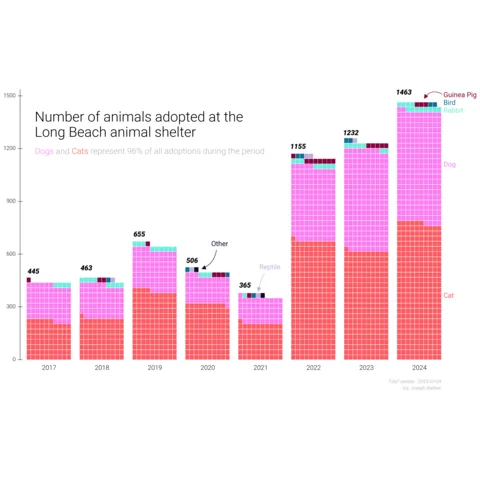 Animal adoption evolution Joseph Barbier 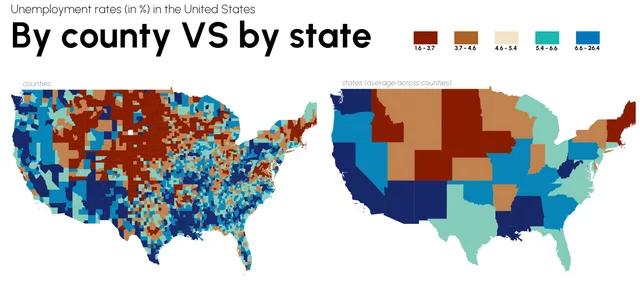 Unemployment rates in the US Joseph Barbier 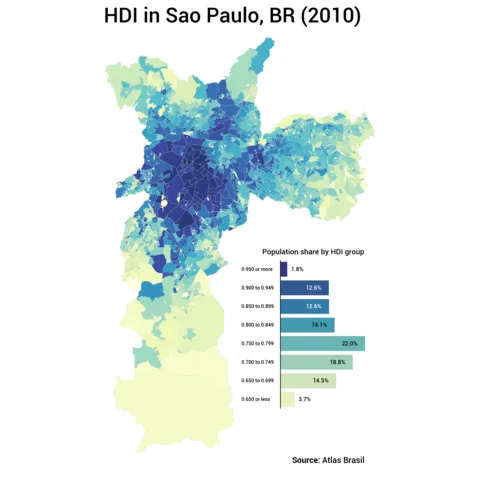 HDI distribution in Sao Paulo Vinicius Oike Reginatto  Evolution of temperature variation Joseph Barbier 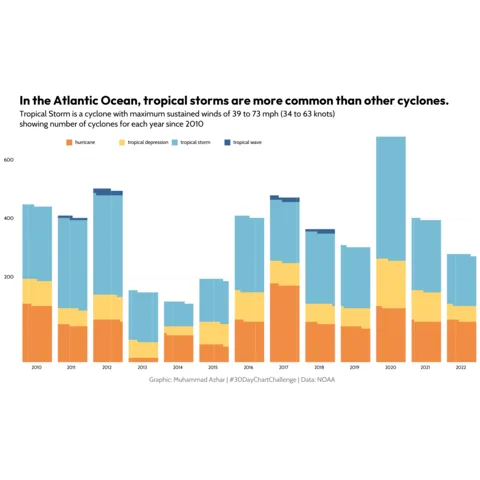 Share of cereals used as animal feeds Muhammad Azhar 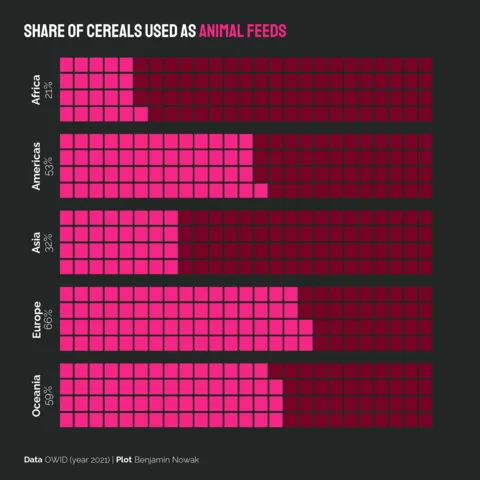 Share of cereals used as animal feeds Benjamin Nowak  Japan's population evolution Joseph Barbier 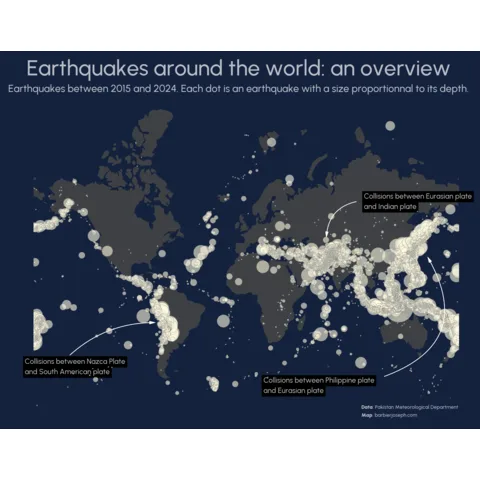 Earthquakes around the world Joseph Barbier 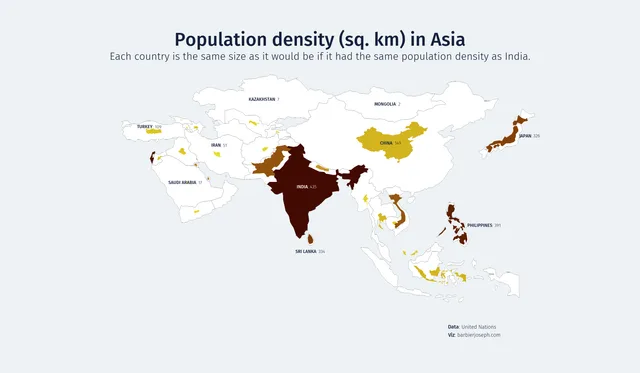 Density population in Asia Joseph Barbier 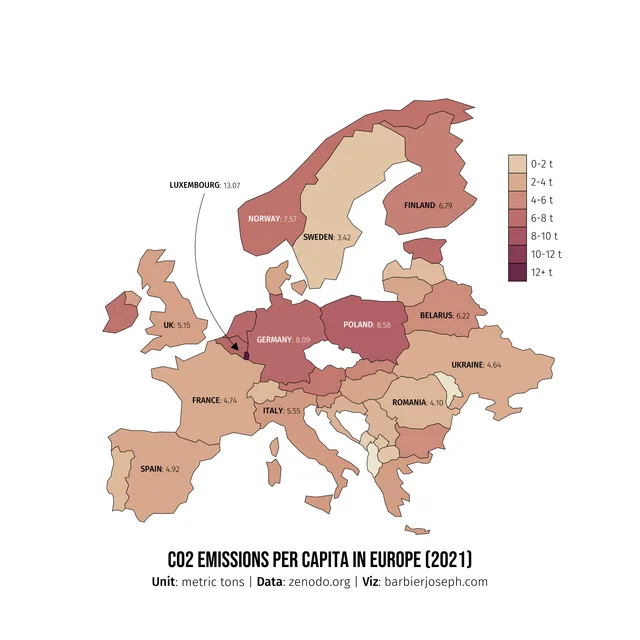 CO2 consumption in Europe Joseph Barbier 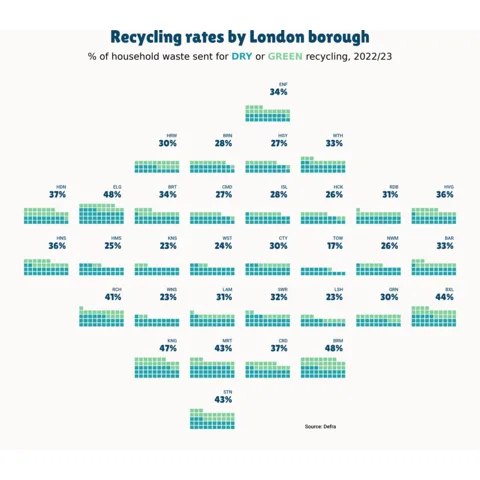 London recycling rates Lisa Hornung 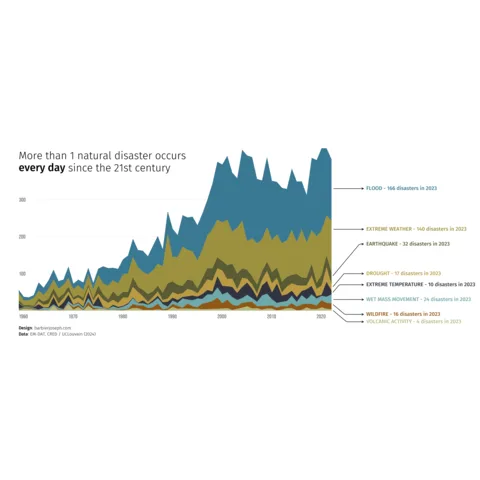 Evolution of natural disasters Joseph Barbier 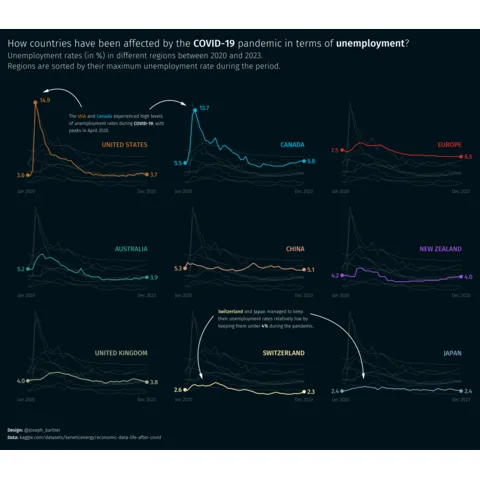 Unemployment rate during COVID-19 Joseph Barbier 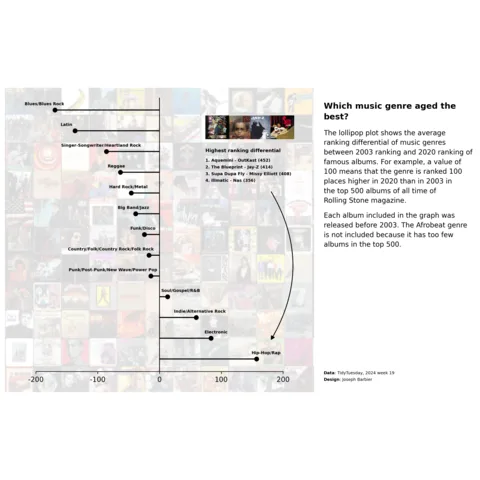 Lollipop about music genres Joseph Barbier 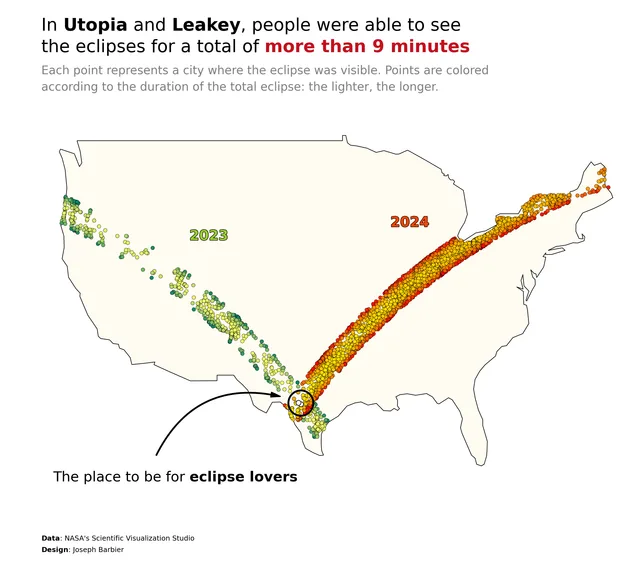 Map with scatter plot on top Joseph Barbier 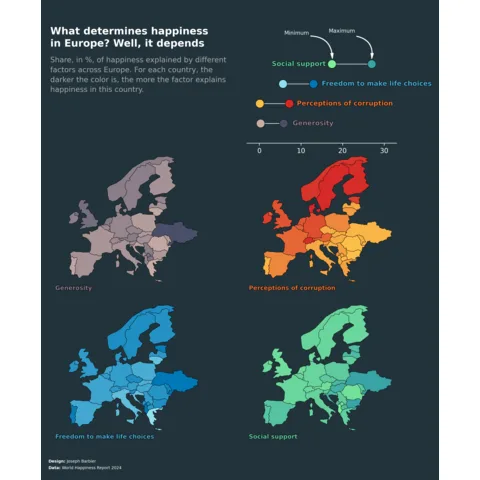 Multiple choropleth map Joseph Barbier 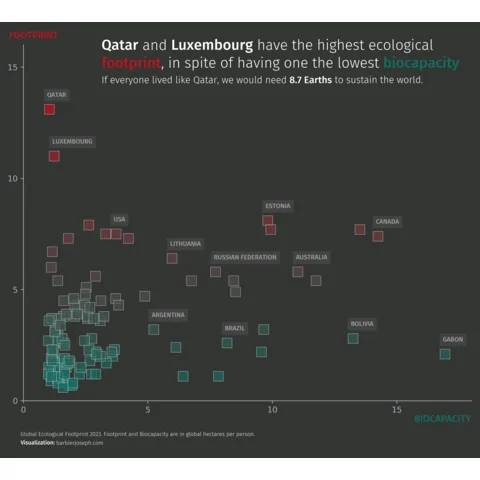 Scatter plot with specific highlights Joseph Barbier 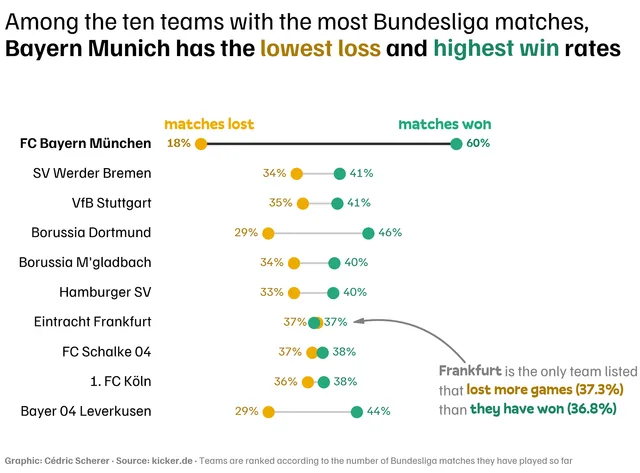 Dumbell chart Cédric Scherer 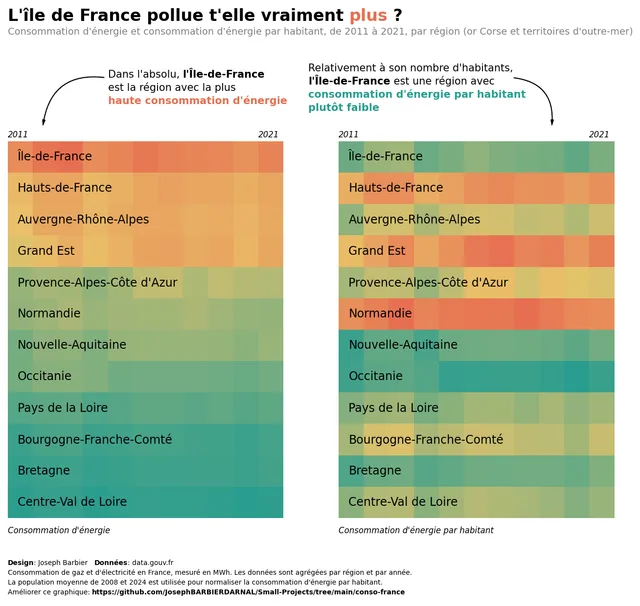 Double heatmap for comparison Joseph Barbier 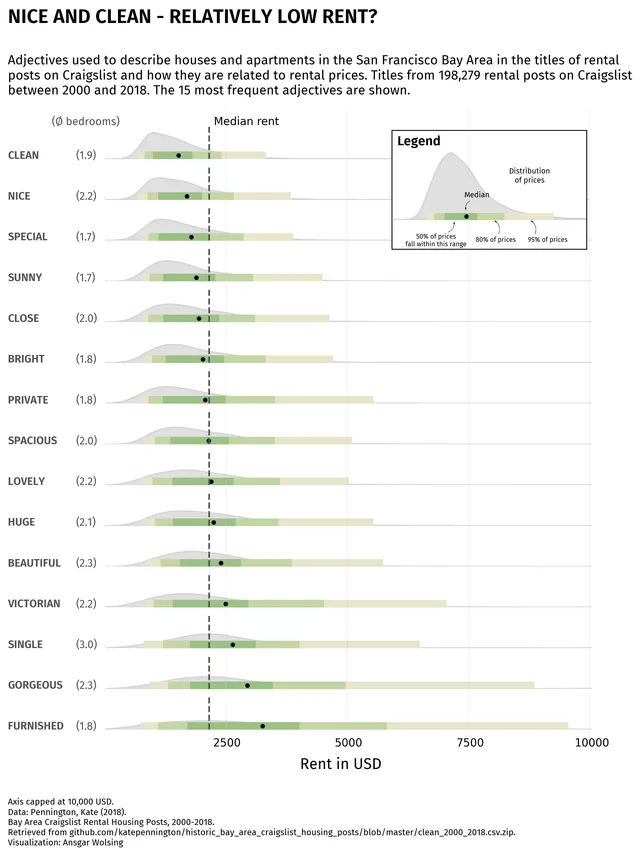 Ridgeline with quantiles display Ansgar Wolsing  Polished table with bubbles Fortune Uwha 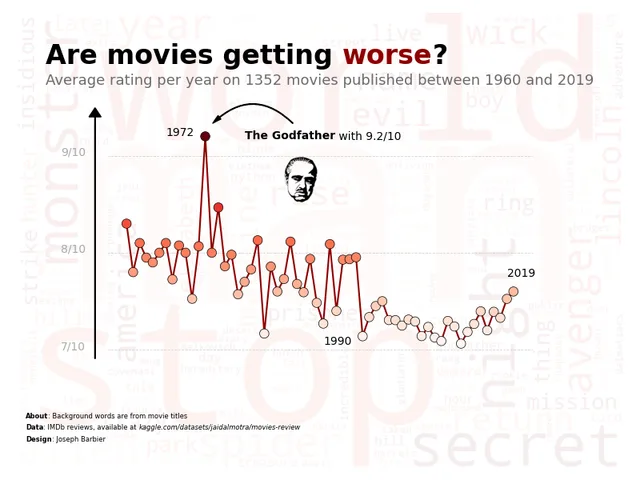 Line chart with word cloud Joseph Barbier 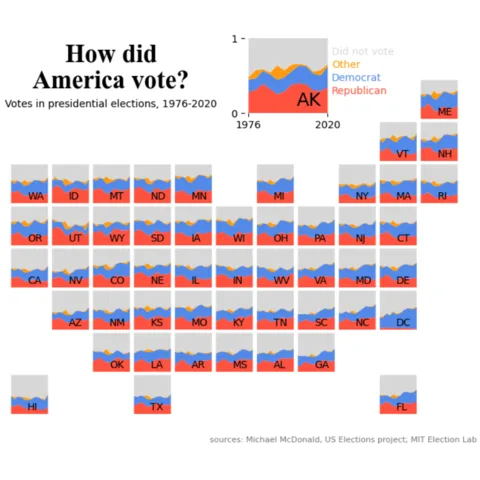 Mini stacked areas for US states Erin  Choropleth map with gradient color Joseph Barbier 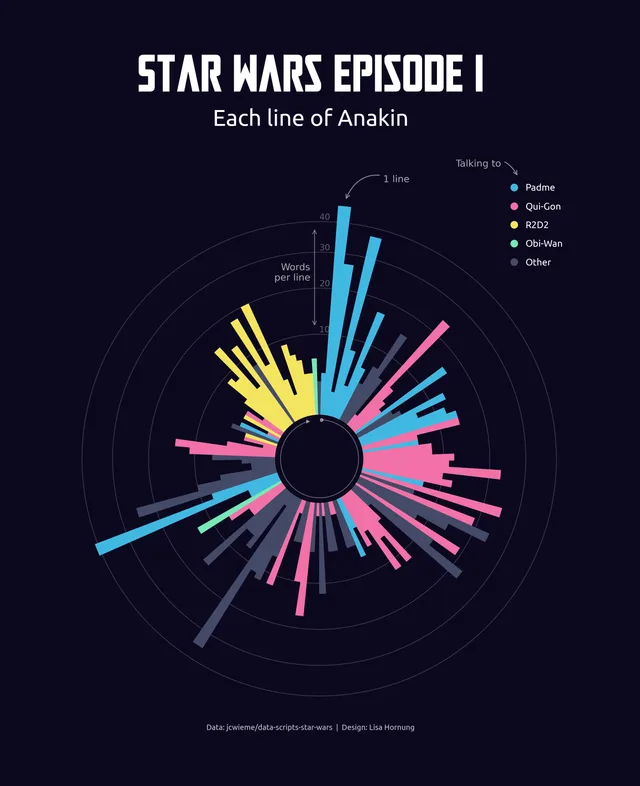 Ordered & Mirrored barplot Lisa Hornung 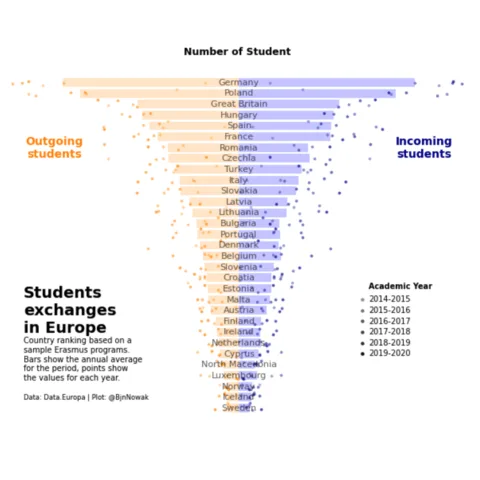 Ordered & Mirrored barplot Benjamin Nowak  Scatterplot with grouping, highlighting and annotation Data Wrapper 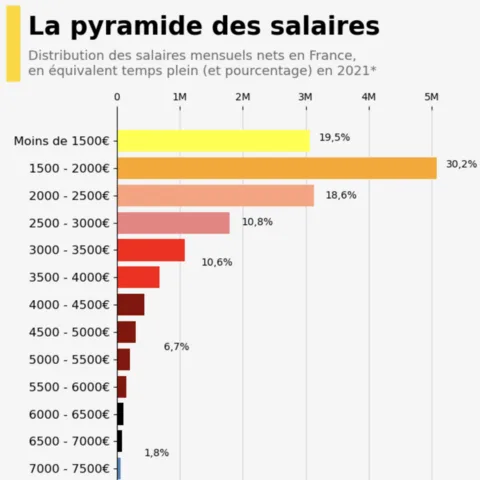 Histogram with clean color scale and annotation INSEE 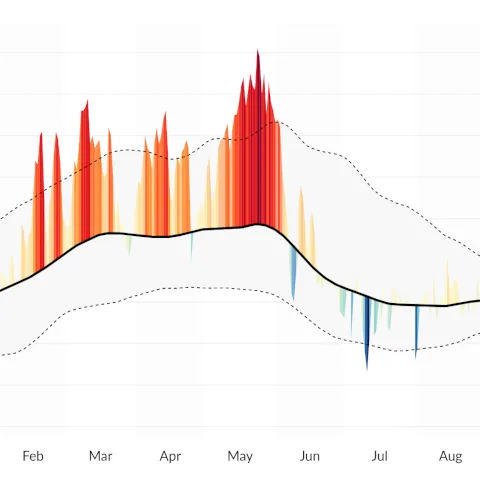 Area over flexible baseline chart J. Kühn 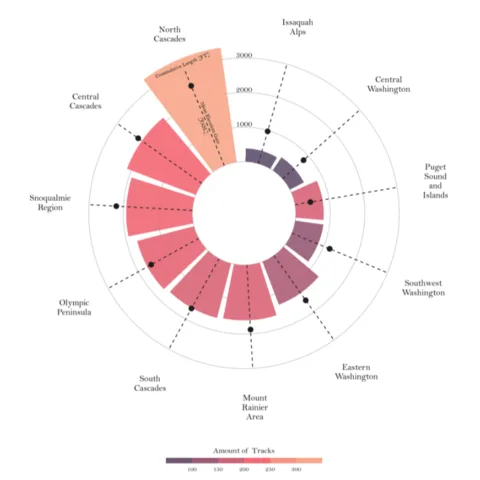 Circular Barplot T. Stadler  Circular Lollipop Plot C. Scherer 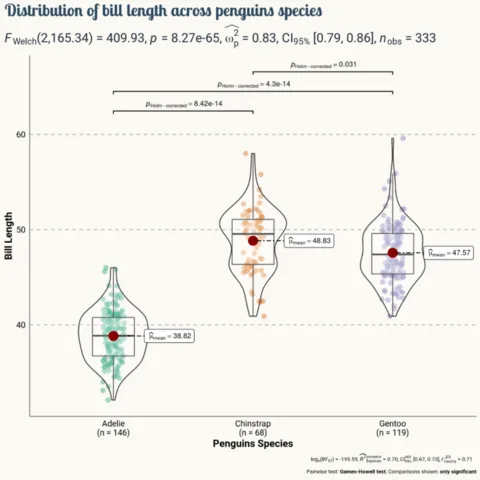 Violin and Boxplot combination T. Wang 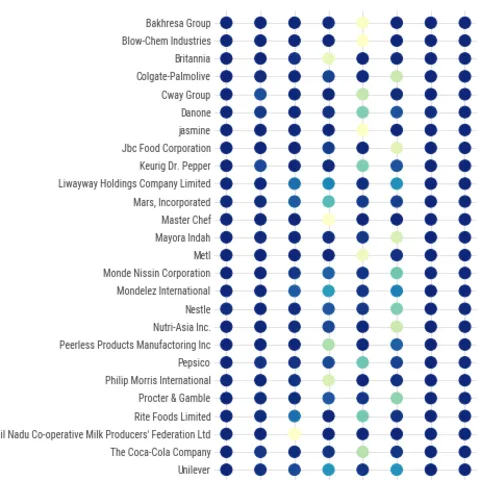 Circle Heatmap M. Siple 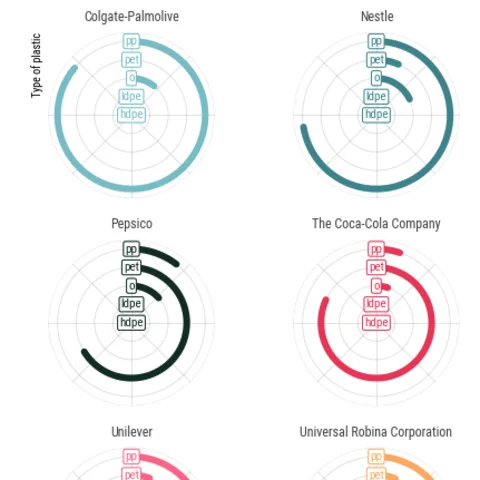 Circular barplot M. Siple 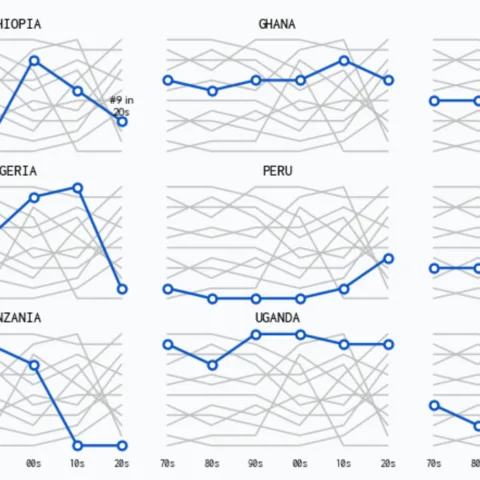 Line chart with faceting A. Madjid 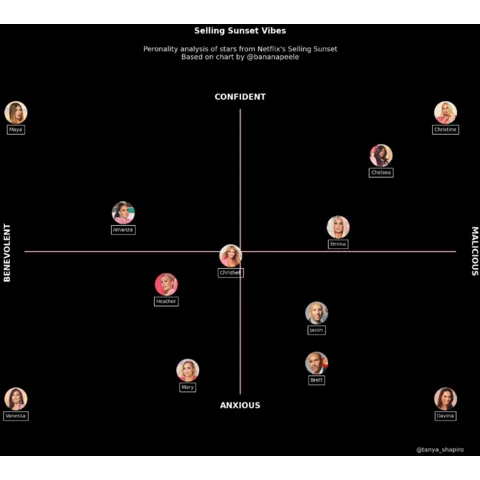 Scatterplot with images Tanya Shapiro  Horizontal Barplot The Economist 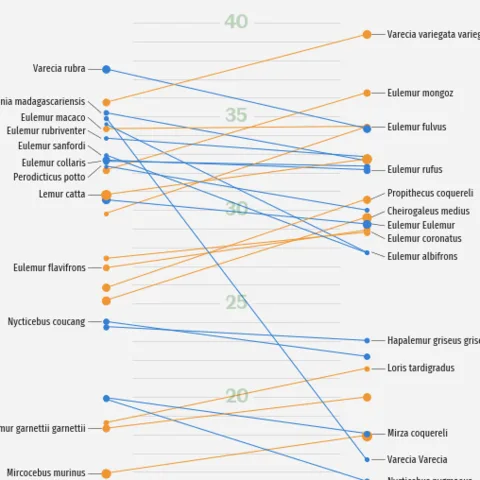 Parallel chart G. Karamanis 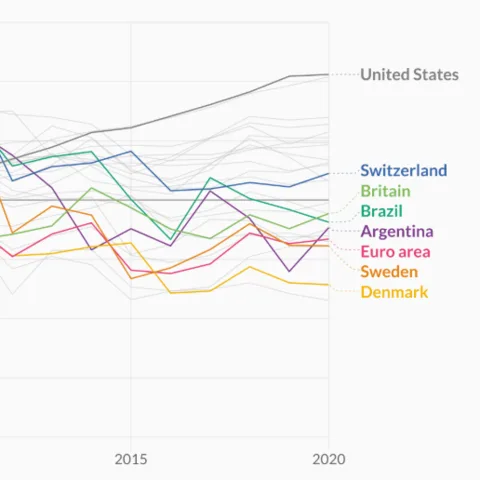 Inline labels C. Scherer  Line chart from the Economist The Economist  Area chart from the Economist The Economist  Lollipop chart C. Scherer 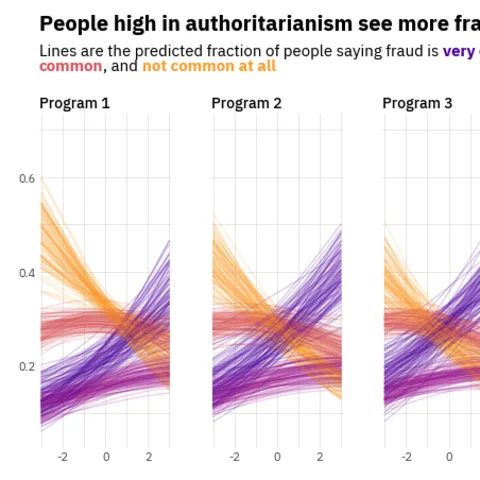 Line chart with small multiple O. Medina 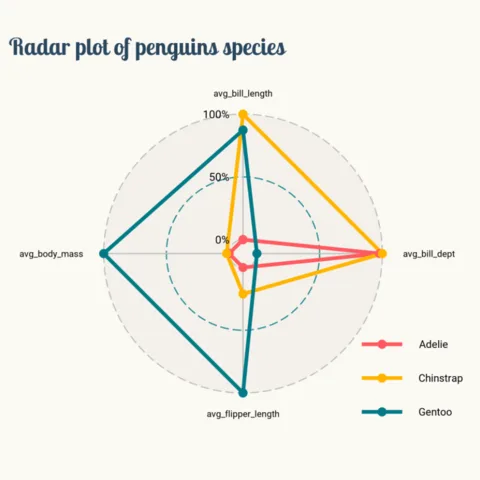 Radar chart with matplotlib T. Wang 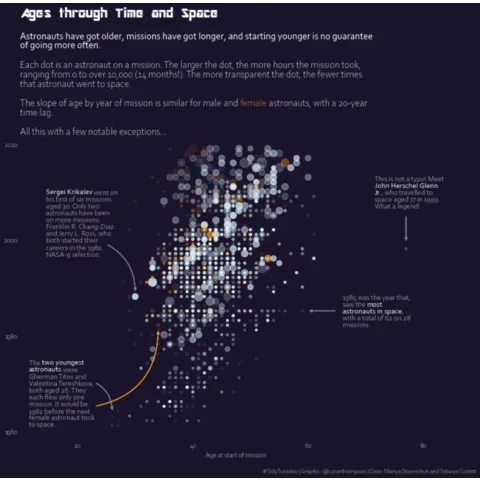 Astronaut Scatterplot C. Thompson  Scatterplot with regression fit C. O. Wilke 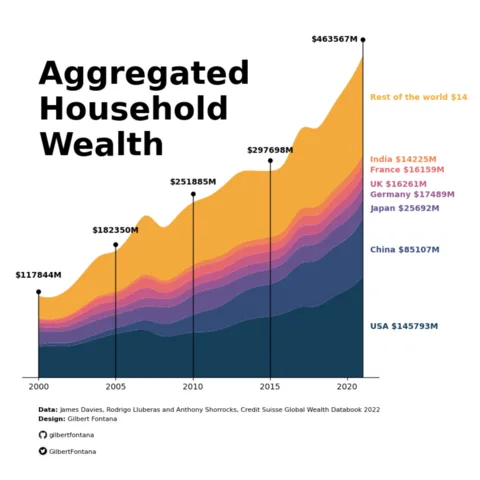 Stacked barchart G. Fontana 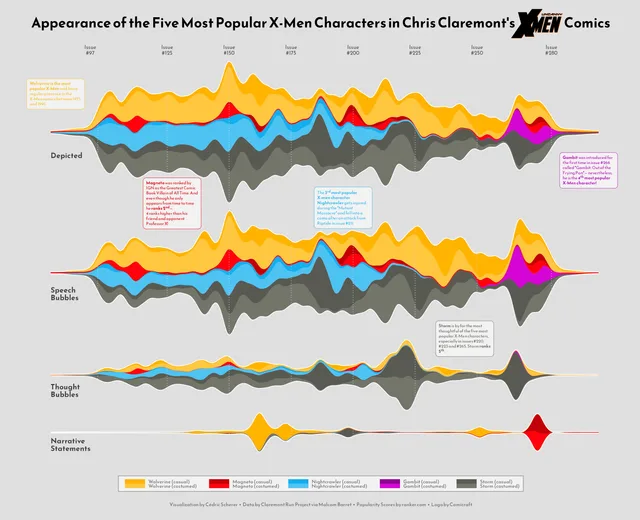 X-men Streamchart C. Scherer 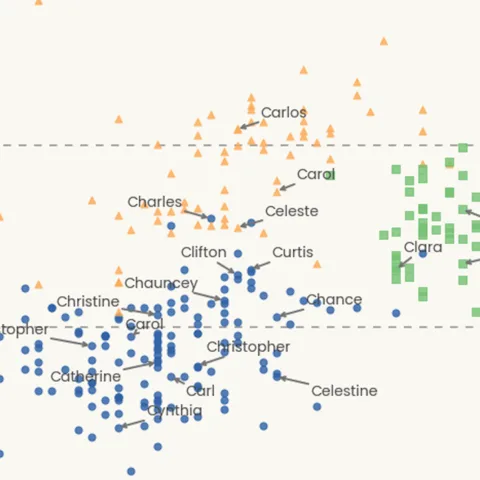 Scatterplot with text repel T. Wang  Timeseries and faceting G. Karamanis 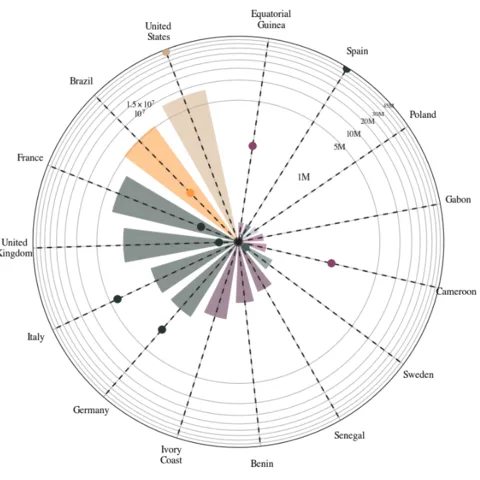 Polar bar chart nyx-it-up 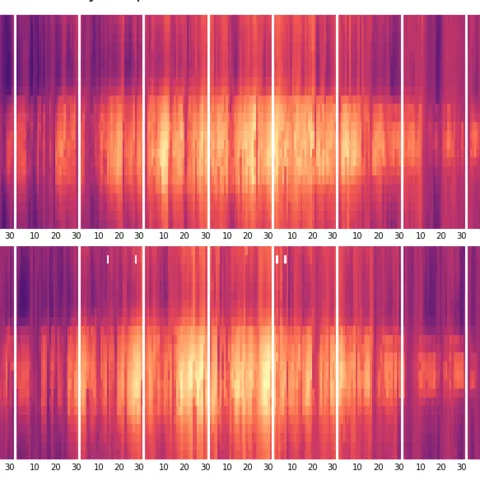 Hourly heatmap J. MacKintosh 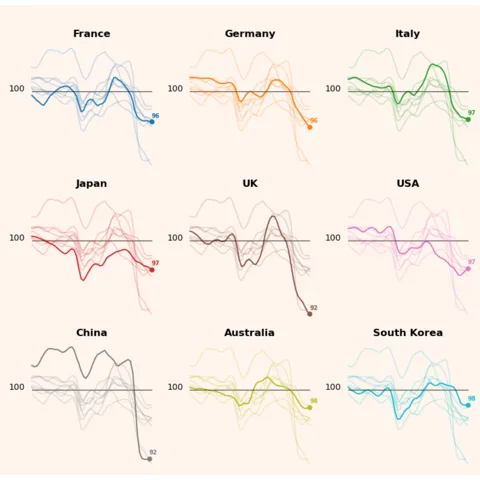 Line chart & small multiple G. Fontana 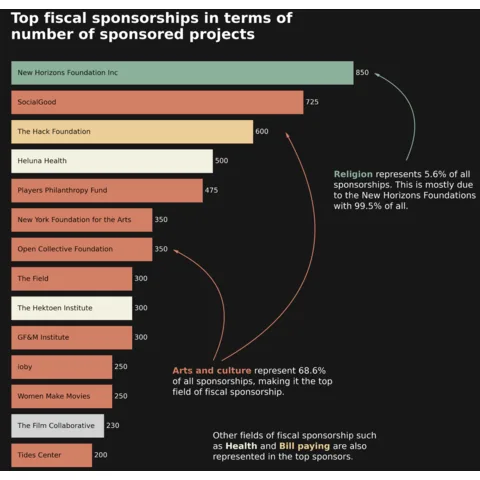 Barplot with annotations and arrows J. Barbier Palette color finderSelecting optimal chart colors can be challenging and time-intensive. The pypalettes library simplifies this process by providing access to over 2,500 color palettes with a single line of code. Additionally, the Python Graph Gallery features a dedicated page where you can browse all these palettes and preview their appearance on your charts.  Python Graphing with State-of-the-Art LibrariesThe python graph gallery relies on the latest and most powerful charting libraries.
|
| You are visitor 01402503 — GeezerVison does not store the pages you look up. Best viewed with Netscape Navigator 4.7 or Internet Explorer 6 at 800×600. No cookies required. |

























 Matplotlib
 Seaborn
 Pandas
 Plotly
 Plotnine