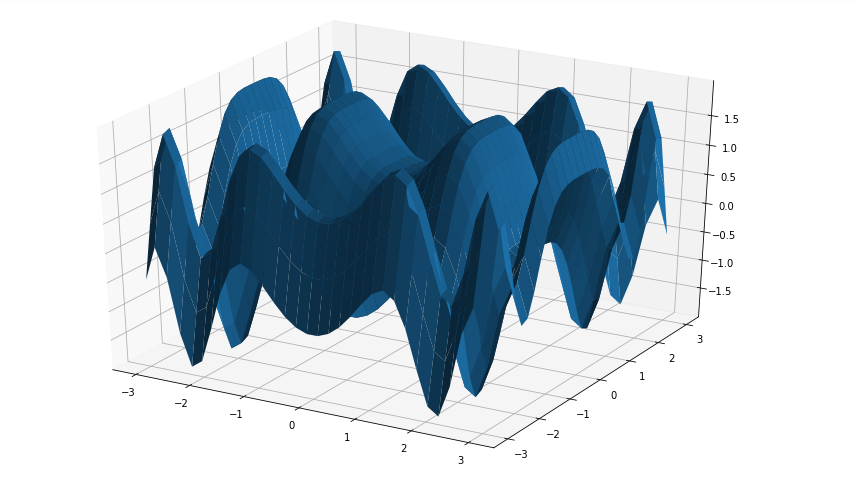
A Surface Plot is a representation of three-dimensional dataset. It describes a functional relationship between two independent variables X and Z and a designated dependent variable Y, rather than showing the individual data points. It is a companion plot of the contour plot. It is similar to the wireframe plot, but each face of the wireframe is a filled polygon. This helps to create the topology of the surface which is being visualized.
Creating 3D surface Plot
The axes3d present in Matplotlib's mpl_toolkits.mplot3d toolkit provides the necessary functions used to create 3D surface plots.Surface plots are created by using ax.plot_surface() function. Syntax:
ax.plot_surface(X, Y, Z)
where X and Y are 2D array of points of x and y while Z is 2D array of heights.Some more attributes of ax.plot_surface() function are listed below:
Attribute
Description
X, Y, Z
2D arrays of data values
cstride
array of column stride(step size)
rstride
array of row stride(step size)
ccount
number of columns to be used, default is 50
rcount
number of row to be used, default is 50
color
color of the surface
cmap
colormap for the surface
norm
instance to normalize values of color map
vmin
minimum value of map
vmax
maximum value of map
facecolors
face color of individual surface
shade
shades the face color
Example: Let's create a 3D surface by using the above function
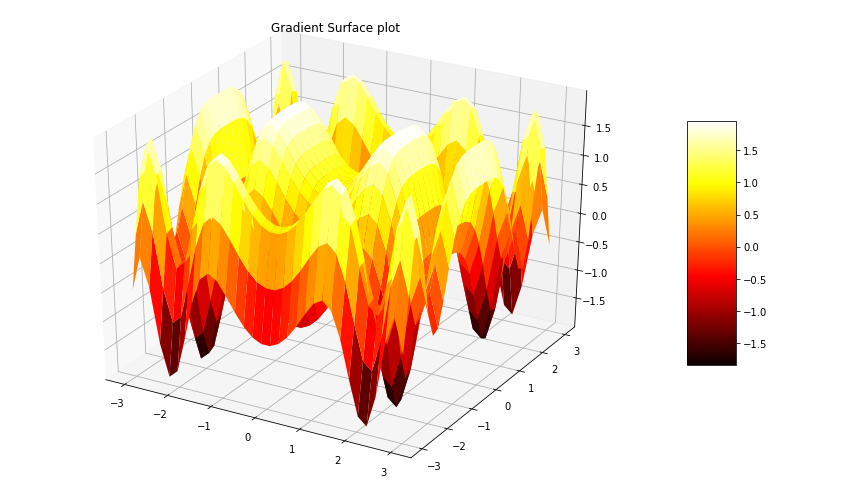
Gradient surface plot is a combination of 3D surface plot with a 2D contour plot. In this plot the 3D surface is colored like 2D contour plot. The parts which are high on the surface contains different color than the parts which are low at the surface. Syntax:
surf = ax.plot_surface(X, Y, Z, cmap=, linewidth=0, antialiased=False)
The attribute cmap= sets the color of the surface. A color bar can also be added by calling fig.colorbar. The code below create a gradient surface plot: Example:
Python3
# Import librariesfrommpl_toolkitsimportmplot3dimportnumpyasnpimportmatplotlib.pyplotasplt# Creating datasetx=np.outer(np.linspace(-3,3,32),np.ones(32))y=x.copy().T# transposez=(np.sin(x**2)+np.cos(y**2))# Creating figurefig=plt.figure(figsize=(14,9))ax=plt.axes(projection='3d')# Creating color mapmy_cmap=plt.get_cmap('hot')# Creating plotsurf=ax.plot_surface(x,y,z,cmap=my_cmap,edgecolor='none')fig.colorbar(surf,ax=ax,shrink=0.5,aspect=5)ax.set_title('Surface plot')# show plotplt.show()
Output:
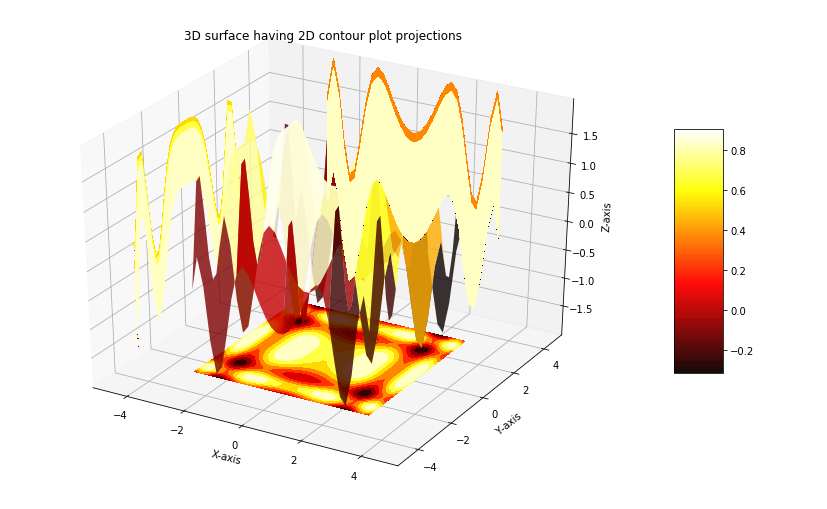
3D surface Plot having 2D contour plot projections
3D surface plots plotted with Matplotlib can be projected on 2D surfaces. The code below creates a 3D plots and visualizes its projection on 2D contour plot: Example:
Python3
# Import librariesfrommpl_toolkitsimportmplot3dimportnumpyasnpimportmatplotlib.pyplotasplt# Creating datasetx=np.outer(np.linspace(-3,3,32),np.ones(32))y=x.copy().T# transposez=(np.sin(x**2)+np.cos(y**2))# Creating figurefig=plt.figure(figsize=(14,9))ax=plt.axes(projection='3d')# Creating color mapmy_cmap=plt.get_cmap('hot')# Creating plotsurf=ax.plot_surface(x,y,z,rstride=8,cstride=8,alpha=0.8,cmap=my_cmap)cset=ax.contourf(x,y,z,zdir='z',offset=np.min(z),cmap=my_cmap)cset=ax.contourf(x,y,z,zdir='x',offset=-5,cmap=my_cmap)cset=ax.contourf(x,y,z,zdir='y',offset=5,cmap=my_cmap)fig.colorbar(surf,ax=ax,shrink=0.5,aspect=5)# Adding labelsax.set_xlabel('X-axis')ax.set_xlim(-5,5)ax.set_ylabel('Y-axis')ax.set_ylim(-5,5)ax.set_zlabel('Z-axis')ax.set_zlim(np.min(z),np.max(z))ax.set_title('3D surface having 2D contour plot projections')# show plotplt.show()
You are visitor 01402503 — GeezerVison does not store the pages you look up. Best viewed with Netscape Navigator 4.7 or Internet Explorer 6 at 800×600. No cookies required.