GeezerVisonThe World Wide Web, restored to 800 pixels of glory. |
| Home|About|Gaming cabinet|Archives|How it works|Starter sites |
GeezerVison is showing www.geeksforgeeks.org — Contour Plot using Matplotlib - Python - GeeksforGeeks  
Contour Plot using Matplotlib - PythonLast Updated : 21 Apr, 2020 Contour plots also called level plots are a tool for doing multivariate analysis and visualizing 3-D plots in 2-D space. If we consider X and Y as our variables we want to plot then the response Z will be plotted as slices on the X-Y plane due to which contours are sometimes referred as Z-slices or iso-response.
Contour plots are widely used to visualize density, altitudes or heights of the mountain as well as in the meteorological department. Due to such wide usage matplotlib.pyplot provides a method contour to make it easy for us to draw contour plots.
matplotlib.pyplot.contourThe matplotlib.pyplot.contour() are usually useful when Z = f(X, Y) i.e Z changes as a function of input X and Y. Acontourf() is also available which allows us to draw filled contours.
Syntax: matplotlib.pyplot.contour([X, Y, ] Z, [levels], **kwargs) Parameters: X, Y: 2-D numpy arrays with same shape as Z or 1-D arrays such that len(X)==M and len(Y)==N (where M and N are rows and columns of Z) Z: The height values over which the contour is drawn. Shape is (M, N) levels: Determines the number and positions of the contour lines / regions. Returns: QuadContourSetBelow examples illustrate the matplotlib.pyplot.contour() function in matplotlib.pyplot:
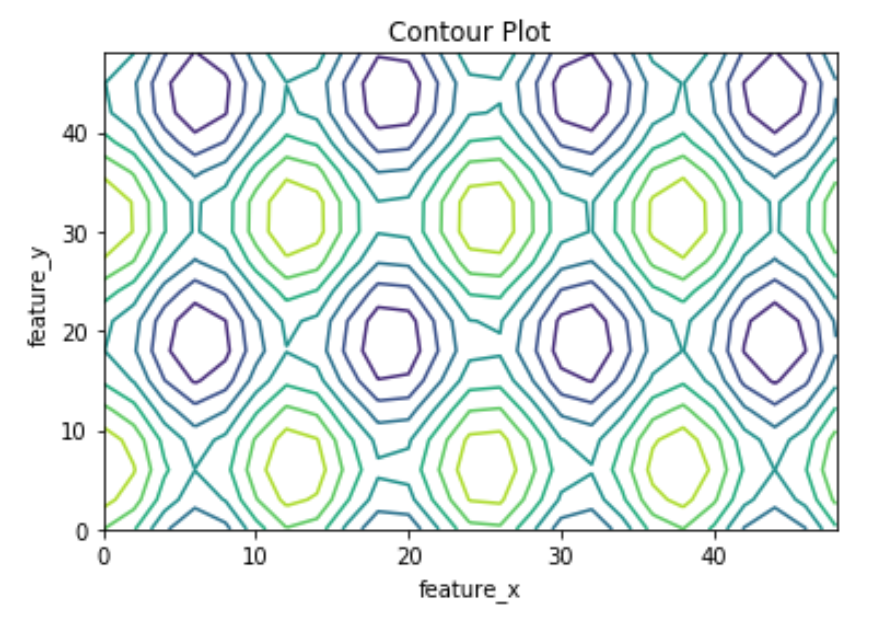
Example #1: Plotting of Contour using contour() which only plots contour lines.
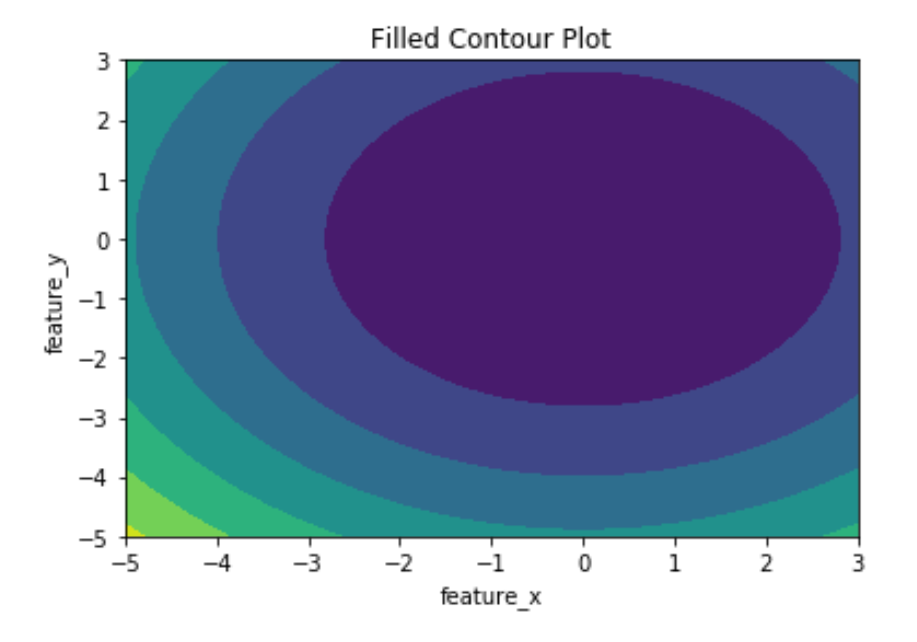
 Example #2: Plotting of contour using contourf() which plots filled contours.
Output:
 Comment Explore |
| You are visitor 01402503 — GeezerVison does not store the pages you look up. Best viewed with Netscape Navigator 4.7 or Internet Explorer 6 at 800×600. No cookies required. |