GV

GeezerVison

The World Wide Web, restored to 800 pixels of glory.

Home|About|Gaming cabinet|Archives|How it works|Starter sites

On this site

  • Python Tutorial
  • Data Types
  • Interview Questions
  • Examples
  • Quizzes
  • DSA Python
  • Data Science
  • NumPy
  • Pandas
  • Practice
  • Django
  • Flask
  • Introduction1 min read
  • Input & Output2 min read

This view

  • Original page
  • New address

GeezerVison is showing www.geeksforgeeks.org — Introduction to Matplotlib - GeeksforGeeks

geeksforgeeks
search icon
  • Courses
  • Tutorials
  • Interview Prep
  • Python Tutorial
  • Data Types
  • Interview Questions
  • Examples
  • Quizzes
  • DSA Python
  • Data Science
  • NumPy
  • Pandas
  • Practice
  • Django
  • Flask

Introduction to Matplotlib

Last Updated : 19 Sep, 2026

Matplotlib is a Python library for creating static, interactive and animated visualizations from data. It provides flexible and customizable plotting functions that help in understanding data patterns, trends and relationships effectively.

Example: Let's create a simple line plot using Matplotlib, showcasing the ease with which you can visualize data.

Python
import matplotlib.pyplot as plt

x = [0, 1, 2, 3, 4]
y = [0, 1, 4, 9, 16]

plt.plot(x, y)
plt.show()

Output

Screenshot-2024-12-05-124024
Simplest plot in Matplotlib

Components or Parts of Matplotlib Figure

Anatomy of a Matplotlib Plot: This section dives into the key components of a Matplotlib plot, including figures, axes, titles and legends, essential for effective data visualization.
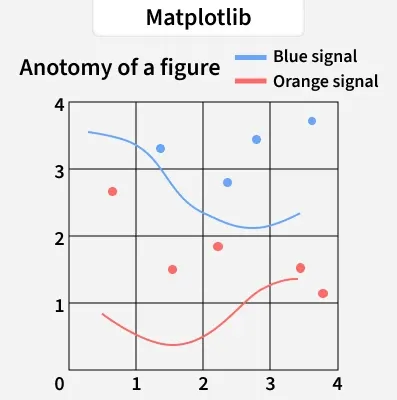
matplotlib
Matplotlib

The parts of a Matplotlib figure include (as shown in the figure above):

  • Figure: The overarching container that holds all plot elements, acting as the canvas for visualizations.
  • Axes: The areas within the figure where data is plotted; each figure can contain multiple axes.
  • Axis: Represents the x-axis and y-axis, defining limits, tick locations and labels for data interpretation.
  • Lines and Markers: Lines connect data points to show trends, while markers denote individual data points in plots like scatter plots.
  • Title and Labels: The title provides context for the plot, while axis labels describe what data is being represented on each axis.

Matplotlib Pyplot

Pyplot is a module within Matplotlib that provides a MATLAB-like interface for making plots. It simplifies the process of adding plot elements such as lines, images and text to the axes of the current figure.

Steps to Use Pyplot:

  • Import Matplotlib: Start by importing matplotlib.pyplot as plt.
  • Create Data: Prepare your data in the form of lists or arrays.
  • Plot Data: Use plt.plot() to create the plot.
  • Customize Plot: Add titles, labels and other elements using methods like plt.title(), plt.xlabel() and plt.ylabel().
  • Display Plot: Use plt.show() to display the plot.

Let's visualize a basic plot and understand basic components of matplotlib figure:

Python
import matplotlib.pyplot as plt

x = [0, 2, 4, 6, 8]
y = [0, 4, 16, 36, 64]
fig, ax = plt.subplots()
ax.plot(x, y, marker='o', label="Data Points")

ax.set_title("Basic Components of Matplotlib Figure")
ax.set_xlabel("X-Axis")
ax.set_ylabel("Y-Axis")

ax.legend() 
plt.show()

Output

Screenshot-2024-12-05-124934
Basic Components of matplotlib figure

Different Types of Plots in Matplotlib

Matplotlib offers a wide range of plot types to suit various data visualization needs. Here are some of the most commonly used types of plots in Matplotlib:

1. Line Chart

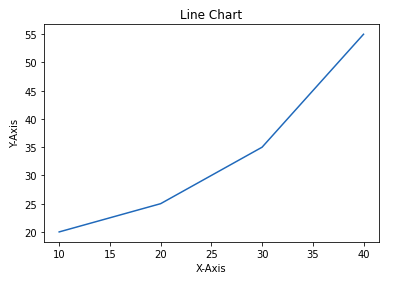
Line chart is one of the basic plots and can be created using plot() function. It is used to represent a relationship between two data X and Y on a different axis.

Example: This code plots a simple line chart with labeled axes and a title using Matplotlib.

Python
import matplotlib.pyplot as plt

x = [10, 20, 30, 40]
y = [20, 25, 35, 55]

plt.plot(x, y)
plt.title("Line Chart")
plt.ylabel('Y-Axis')
plt.xlabel('X-Axis')
plt.show()

Output

line chart matplotlib

Syntax:

matplotlib.pyplot.plot(x, y)

Parameter: x, y Coordinates for data points.

2. Bar Chart

Bar chart displays categorical data using rectangular bars whose lengths are proportional to the values they represent. It can be plotted vertically or horizontally to compare different categories.

Example: This code creates a simple bar chart to show total bills for different days. X-axis represents the days and Y-axis shows total bill amount.

Python
import matplotlib.pyplot as plt

x = ['Thur', 'Fri', 'Sat', 'Sun']
y = [170, 120, 250, 190]

plt.bar(x, y)
plt.title("Bar Chart")
plt.xlabel("Day")
plt.ylabel("Total Bill")
plt.show()

Output

barchartmatplotlib

Syntax:

matplotlib.pyplot.bar(x, height)

Parameter:

  • x: Categories or positions on x-axis.
  • height: Heights of the bars (y-axis values).

3. Histogram

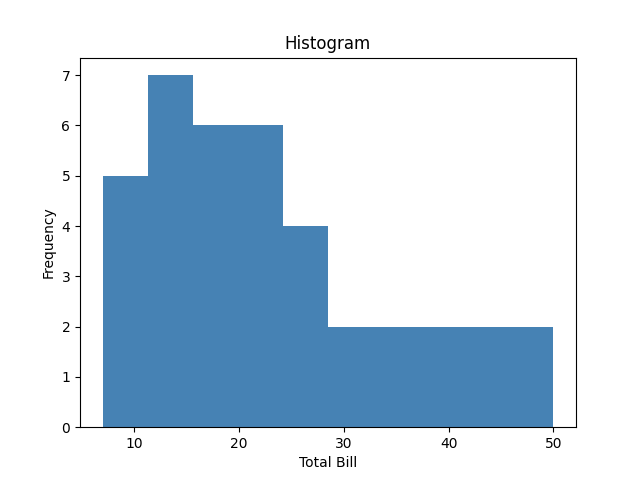
Histogram shows the distribution of data by grouping values into bins. The hist() function is used to create it, with X-axis showing bins and Y-axis showing frequencies.

Example: This code plots a histogram to show frequency distribution of total bill values from the list x. It uses 10 bins and adds axis labels and a title for clarity.

Python
import matplotlib.pyplot as plt

x = [7, 8, 9, 10, 10, 12, 12, 12, 13, 14, 14, 15, 16, 16, 17, 18, 18, 19, 20, 20,
     21, 22, 23, 24, 25, 25, 26, 28, 30, 32, 35, 36, 38, 40, 42, 44, 48, 50]

plt.hist(x, bins=10, color='steelblue')
plt.title("Histogram")
plt.xlabel("Total Bill")
plt.ylabel("Frequency")
plt.show()

Output

histogrammatplotlib

Syntax:

matplotlib.pyplot.hist(x, bins=None)

Parameter:

  • x: Input data.
  • bins: Number of bins (intervals) to group data.

4. Scatter Plot

Scatter plots are used to observe relationships between variables. The scatter() method in the matplotlib library is used to draw a scatter plot.

Example: This code creates a scatter plot to visualize the relationship between days and total bill amounts using scatter().

Python
import matplotlib.pyplot as plt

x = [10, 15, 20, 25, 30]
y = [12, 18, 25, 28, 35]

plt.scatter(x, y)

plt.title("Scatter Plot")
plt.xlabel("Study Hours")
plt.ylabel("Marks")

plt.show()

Output

Scatter-Plot

Syntax:

matplotlib.pyplot.scatter(x, y)

Parameter: x, y Coordinates of the points.

5. Pie Chart

Pie chart is a circular chart used to show data as proportions or percentages. It is created using the pie(), where each slice (wedge) represents a part of the whole.

Example: This code creates a simple pie chart to visualize distribution of different car brands. Each slice of pie represents the proportion of cars for each brand in the dataset.

Python
import matplotlib.pyplot as plt

cars = ['AUDI', 'BMW', 'FORD','TESLA', 'JAGUAR',]
data = [23, 10, 35, 15, 12]

plt.pie(data, labels=cars, autopct='%1.1f%%')
plt.title(" Pie Chart")
plt.show()

Output

Pie

Syntax:

matplotlib.pyplot.pie(x, labels=None, autopct=None)

Parameter:

  • x: Data values for pie slices.
  • labels: Names for each slice.
  • autopct: Format to display percentage (e.g., '%1.1f%%').

6. Box Plot

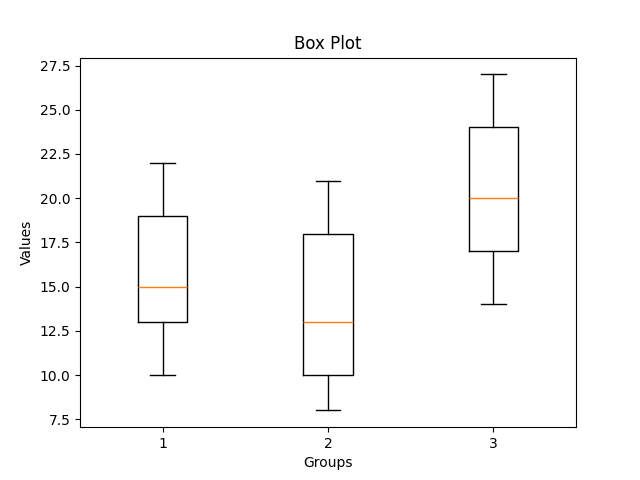
Box plot is a simple graph that shows how data is spread out. It displays the minimum, maximum, median and quartiles and also helps to spot outliers easily.

Example: This code creates a box plot to show the data distribution and compare three groups using matplotlib

Python
import matplotlib.pyplot as plt

data = [ [10, 12, 14, 15, 18, 20, 22],
         [8, 9, 11, 13, 17, 19, 21],
         [14, 16, 18, 20, 23, 25, 27] ]

plt.boxplot(data)
plt.xlabel("Groups")
plt.ylabel("Values")
plt.title("Box Plot")
plt.show()

Output

boxplotmatplotlib

Syntax:

matplotlib.pyplot.boxplot(x, notch=False, vert=True)

Parameter:

  • x: Data for which box plot is to be drawn (usually a list or array).
  • notch: If True, draws a notch to show the confidence interval around the median.
  • vert: If True, boxes are vertical. If False, they are horizontal.

7. Heatmap

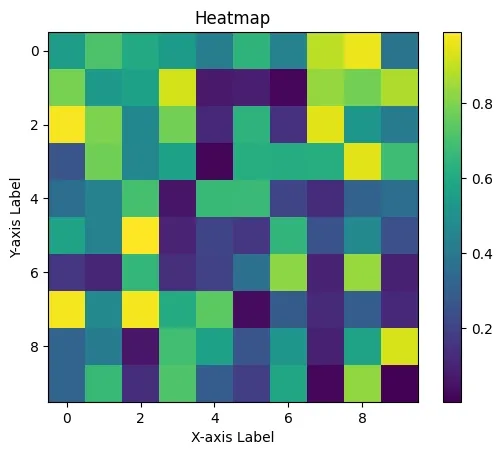
Heatmap is a graphical representation of data where values are shown as colors. It helps visualize patterns, correlations or intensity in a matrix-like format. It is created using imshow() method in Matplotlib.

Example: This code creates a heatmap of random 10×10 data using imshow(). It uses 'viridis' color map and colorbar() adds a color scale.

Python
import matplotlib.pyplot as plt
import numpy as np

np.random.seed(0)
data = np.random.rand(10, 10)

plt.imshow(data, cmap='viridis', interpolation='nearest')

plt.colorbar()
plt.xlabel('X-axis Label')
plt.ylabel('Y-axis Label')
plt.title('Heatmap')
plt.show()

Output

heatmapMatplotlib

Explanation:

  • np.random.seed(0): Ensures same random values every time (reproducibility).
  • np.random.rand(10, 10): Generates a 10×10 array of random numbers between 0 and 1.

Syntax:

matplotlib.pyplot.imshow(X, cmap='viridis')

Parameter:

  • X: 2D array (data to display as an image or heatmap).
  • cmap: Sets the color map.

Key Features

  • Create a wide variety of visualizations, including line plots, scatter plots, bar charts and histograms.
  • Control every aspect of your plots, from colors and markers to labels and annotations.
  • Effortlessly plot data arrays directly, enhancing data manipulation capabilities.
  • Generate publication-ready plots with precise control over aesthetics.
  • Use Matplotlib on Windows, macOS and Linux without issues.
  • Engage with your data dynamically through interactive plotting features.
Comment

Explore

    Python Fundamentals
    • Introduction1 min read
    • Input & Output2 min read
    • Variables4 min read
    • Operators4 min read
    • Keywords2 min read
    • Data Types4 min read
    • Conditional Statements3 min read
    • Loops3 min read
    • Functions4 min read
    Python Data Structures
    • String4 min read
    • List3 min read
    • Tuples3 min read
    • Dictionary3 min read
    • Set2 min read
    • Arrays5 min read
    Advanced Python
    • OOP Concepts3 min read
    • Exception Handling5 min read
    • File Handling4 min read
    • Python Database2 min read
    • MongoDB3 min read
    • MySQL7 min read
    • Packages4 min read
    • Modules3 min read
    • DSA Libraries5 min read
    • Python GUI2 min read
    Data Science with Python
    • Numpy3 min read
    • Pandas4 min read
    • Matplotlib3 min read
    • Seaborn3 min read
    • StatsModel2 min read
    • Model Building6 min read
    • TensorFlow2 min read
    • PyTorch5 min read
    Web Development with Python
    • Flask3 min read
    • Django5 min read
    • Django ORM4 min read
    • Jinja2 Templating5 min read
    • Django Templates5 min read
    • REST API3 min read
    • Build API with DRF4 min read
    Python Practice
    • Quiz1 min read
    • Practice Problems2 min read
    • Interview Q & A15+ min read
    Courses
    • Placement 360 Course2 min read
    • Data Science 360 Course2 min read
    • AI Engg Course2 min read
You are visitor 01402503 — GeezerVison does not store the pages you look up.
Best viewed with Netscape Navigator 4.7 or Internet Explorer 6 at 800×600. No cookies required.