GV

GeezerVison

The World Wide Web, restored to 800 pixels of glory.

Home|About|Gaming cabinet|Archives|How it works|Starter sites

On this site

  • Python Tutorial
  • Data Types
  • Interview Questions
  • Examples
  • Quizzes
  • DSA Python
  • Data Science
  • NumPy
  • Pandas
  • Practice
  • Django
  • Flask
  • Introduction1 min read
  • Input & Output2 min read

This view

  • Original page
  • New address

GeezerVison is showing www.geeksforgeeks.org — Python | math.sin() function - GeeksforGeeks

geeksforgeeks
search icon
  • Courses
  • Tutorials
  • Interview Prep
  • Python Tutorial
  • Data Types
  • Interview Questions
  • Examples
  • Quizzes
  • DSA Python
  • Data Science
  • NumPy
  • Pandas
  • Practice
  • Django
  • Flask

Python | math.sin() function

Last Updated : 20 Mar, 2019
In Python, math module contains a number of mathematical operations, which can be performed with ease using the module. math.sin() function returns the sine of value passed as argument. The value passed in this function should be in radians.
Syntax: math.sin(x) Parameter: x : value to be passed to sin() Returns: Returns the sine of value passed as argument
Code #1: Python3 1==
# Python code to demonstrate the working of sin()
   
# importing "math" for mathematical operations 
import math 
  
a = math.pi / 6
   
# returning the value of sine of pi / 6 
print ("The value of sine of pi / 6 is : ", end ="") 
print (math.sin(a)) 
Output:
The value of sine of pi/6 is : 0.49999999999999994
  Code #2: Python3 1==
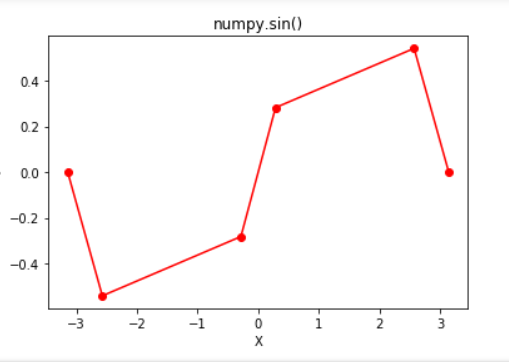
# Python program showing 
# Graphical representation of 
# sin() function 
import math
import matplotlib.pyplot as plt 

in_array = [-3.14159265, -2.57039399, -0.28559933,
            0.28559933, 2.57039399,  3.14159265]

out_array = []

for i in range(len(in_array)):
    out_array.append(math.sin(in_array[i]))
    i += 1

 
print("in_array : ", in_array) 
print("\nout_array : ", out_array) 

# red for numpy.sin() 
plt.plot(in_array, out_array, color = 'red', marker = "o") 
plt.title("math.sin()") 
plt.xlabel("X") 
plt.ylabel("Y") 
plt.show() 
Output:
in_array : [-3.14159265, -2.57039399, -0.28559933, 0.28559933, 2.57039399, 3.14159265] out_array : [-3.5897930298416118e-09, -0.5406408168673427, -0.2817325547837714, 0.2817325547837714, 0.5406408168673427, 3.5897930298416118e-09]
Comment

Explore

    Python Fundamentals
    • Introduction1 min read
    • Input & Output2 min read
    • Variables4 min read
    • Operators4 min read
    • Keywords2 min read
    • Data Types4 min read
    • Conditional Statements3 min read
    • Loops3 min read
    • Functions4 min read
    Python Data Structures
    • String4 min read
    • List3 min read
    • Tuples3 min read
    • Dictionary3 min read
    • Set2 min read
    • Arrays5 min read
    Advanced Python
    • OOP Concepts3 min read
    • Exception Handling5 min read
    • File Handling4 min read
    • Python Database2 min read
    • MongoDB3 min read
    • MySQL7 min read
    • Packages4 min read
    • Modules3 min read
    • DSA Libraries5 min read
    • Python GUI2 min read
    Data Science with Python
    • Numpy3 min read
    • Pandas4 min read
    • Matplotlib3 min read
    • Seaborn3 min read
    • StatsModel2 min read
    • Model Building6 min read
    • TensorFlow2 min read
    • PyTorch5 min read
    Web Development with Python
    • Flask3 min read
    • Django5 min read
    • Django ORM4 min read
    • Jinja2 Templating5 min read
    • Django Templates5 min read
    • REST API3 min read
    • Build API with DRF4 min read
    Python Practice
    • Quiz1 min read
    • Practice Problems2 min read
    • Interview Q & A15+ min read
    Courses
    • Placement 360 Course2 min read
    • Data Science 360 Course2 min read
    • AI Engg Course2 min read
You are visitor 01402503 — GeezerVison does not store the pages you look up.
Best viewed with Netscape Navigator 4.7 or Internet Explorer 6 at 800×600. No cookies required.