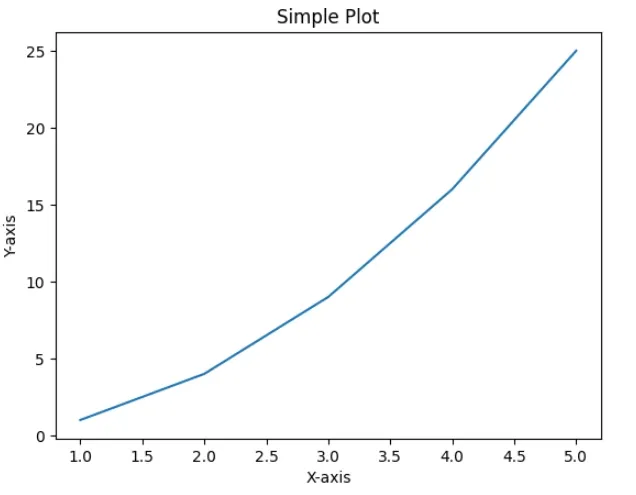
Creating simple plots is a common step in data visualization. These visual representations help us to understand trends, patterns and relationships within data. Matplotlib isone of the most popular plotting libraries in Python which makes it easy to generate high-quality graphs with just a few lines of code. In this article, we'll see how to create basic plots using Matplotlib.
Before we start creating plots we need to install Matplotlib. We can install it using below command:
x: A sequence of values to be plotted along the x-axis.
y: A sequence of values to be plotted along the y-axis.
format_string: A string that specifies the line style, color and markers. It is a optional parameter.
**kwargs: Other optional parameters such as label, linewidth, markersize, etc.
Key Matplotlib Functions for Simple Plots
Method
Description
plot()
This function creates a plot from the given data. It doesn’t display the plot but allows us to customize it.
show()
This function displays the created plot. Without it the plot won't appear on the screen.
xlabel(),ylabel()
These functions add labels to the x-axis and y-axis which helps in making our plot more understandable.
title()
Adds a title to the plot to provide context.
gca()
This function returns the current Axes object which is useful for modifying individual aspects of the plot such as spines, ticks, etc.
xticks(), yticks()
Control where the ticks on the x-axis and y-axis appear. We can define the positions and step size.
legend()
Adds a legend to the plot which is helpful when we have multiple data series in the same plot.
annotate()
Adds annotations like text or markers at specific positions on the plot which is useful for highlighting key data points.
figure(figsize = (x, y))
Creates a figure with a specified size where x is the width and y is the height.
subplot(r, c, i)
Creates multiple subplots in the same figure. r is the number of rows, c is the number of columns and i specifies the subplot's position.
set_xticks, set_yticks
Allows customization of the range and step size of the ticks on the x-axis and y-axis useful in subplots.
Lets see various examples for customizing plots by using different functions.
Example 1: Creating a Customized Line Plot with Multiple Series
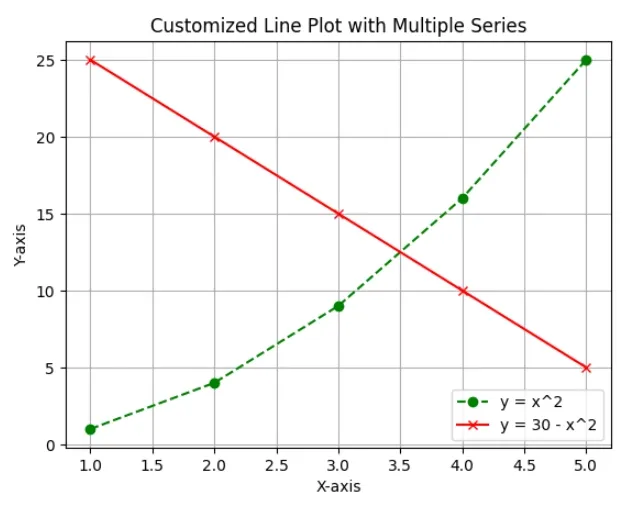
In this example, we’ll create a line plot with two different functions: y = x^2 and y = 30 - x^2. We will also customize the plot by adding gridlines, labels, title and legend.
Python
importmatplotlib.pyplotaspltx=[1,2,3,4,5]y1=[1,4,9,16,25]y2=[25,20,15,10,5]plt.plot(x,y1,label='y = x^2',color='green',linestyle='--',marker='o')plt.plot(x,y2,label='y = 30 - x^2',color='red',linestyle='-',marker='x')plt.grid(True)plt.xlabel('X-axis')plt.ylabel('Y-axis')plt.title('Customized Line Plot with Multiple Series')plt.legend()plt.savefig('all_features_plot.png')plt.show()
Output:
Customized Line
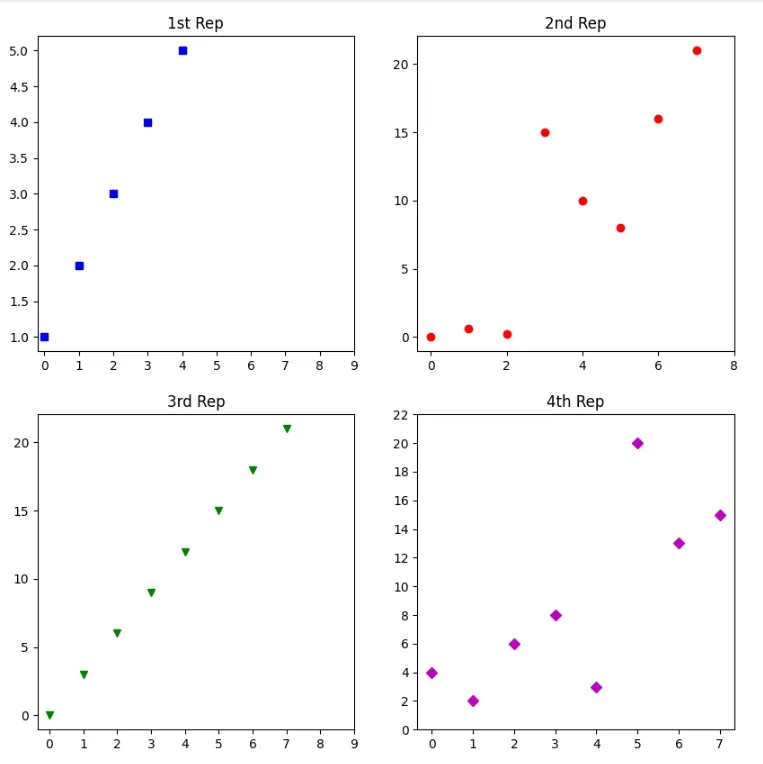
Example 2: Creating Multiple Subplots in One Figure
We will create four different subplots in a 2x2 grid. Each subplot will display a different dataset. This technique is useful when we want to compare multiple datasets side by side in a single figure.
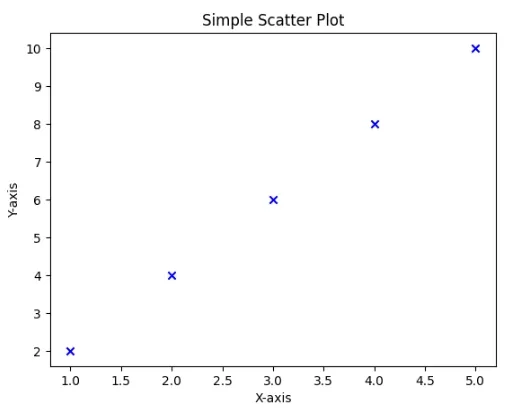
Scatter plots are basic type of plot used to visualize the relationship between two variables. This is useful when we want to see how one variable is related to another or look for correlations.
With these simple techniques and examples we're now ready to start visualizing our data effectively using Matplotlib whether we're working with line plots, subplots or scatter plots.
You are visitor 01402503 — GeezerVison does not store the pages you look up. Best viewed with Netscape Navigator 4.7 or Internet Explorer 6 at 800×600. No cookies required.