GeezerVisonThe World Wide Web, restored to 800 pixels of glory. | |||||||||||||||||||||||||
| Home|About|Gaming cabinet|Archives|How it works|Starter sites | |||||||||||||||||||||||||
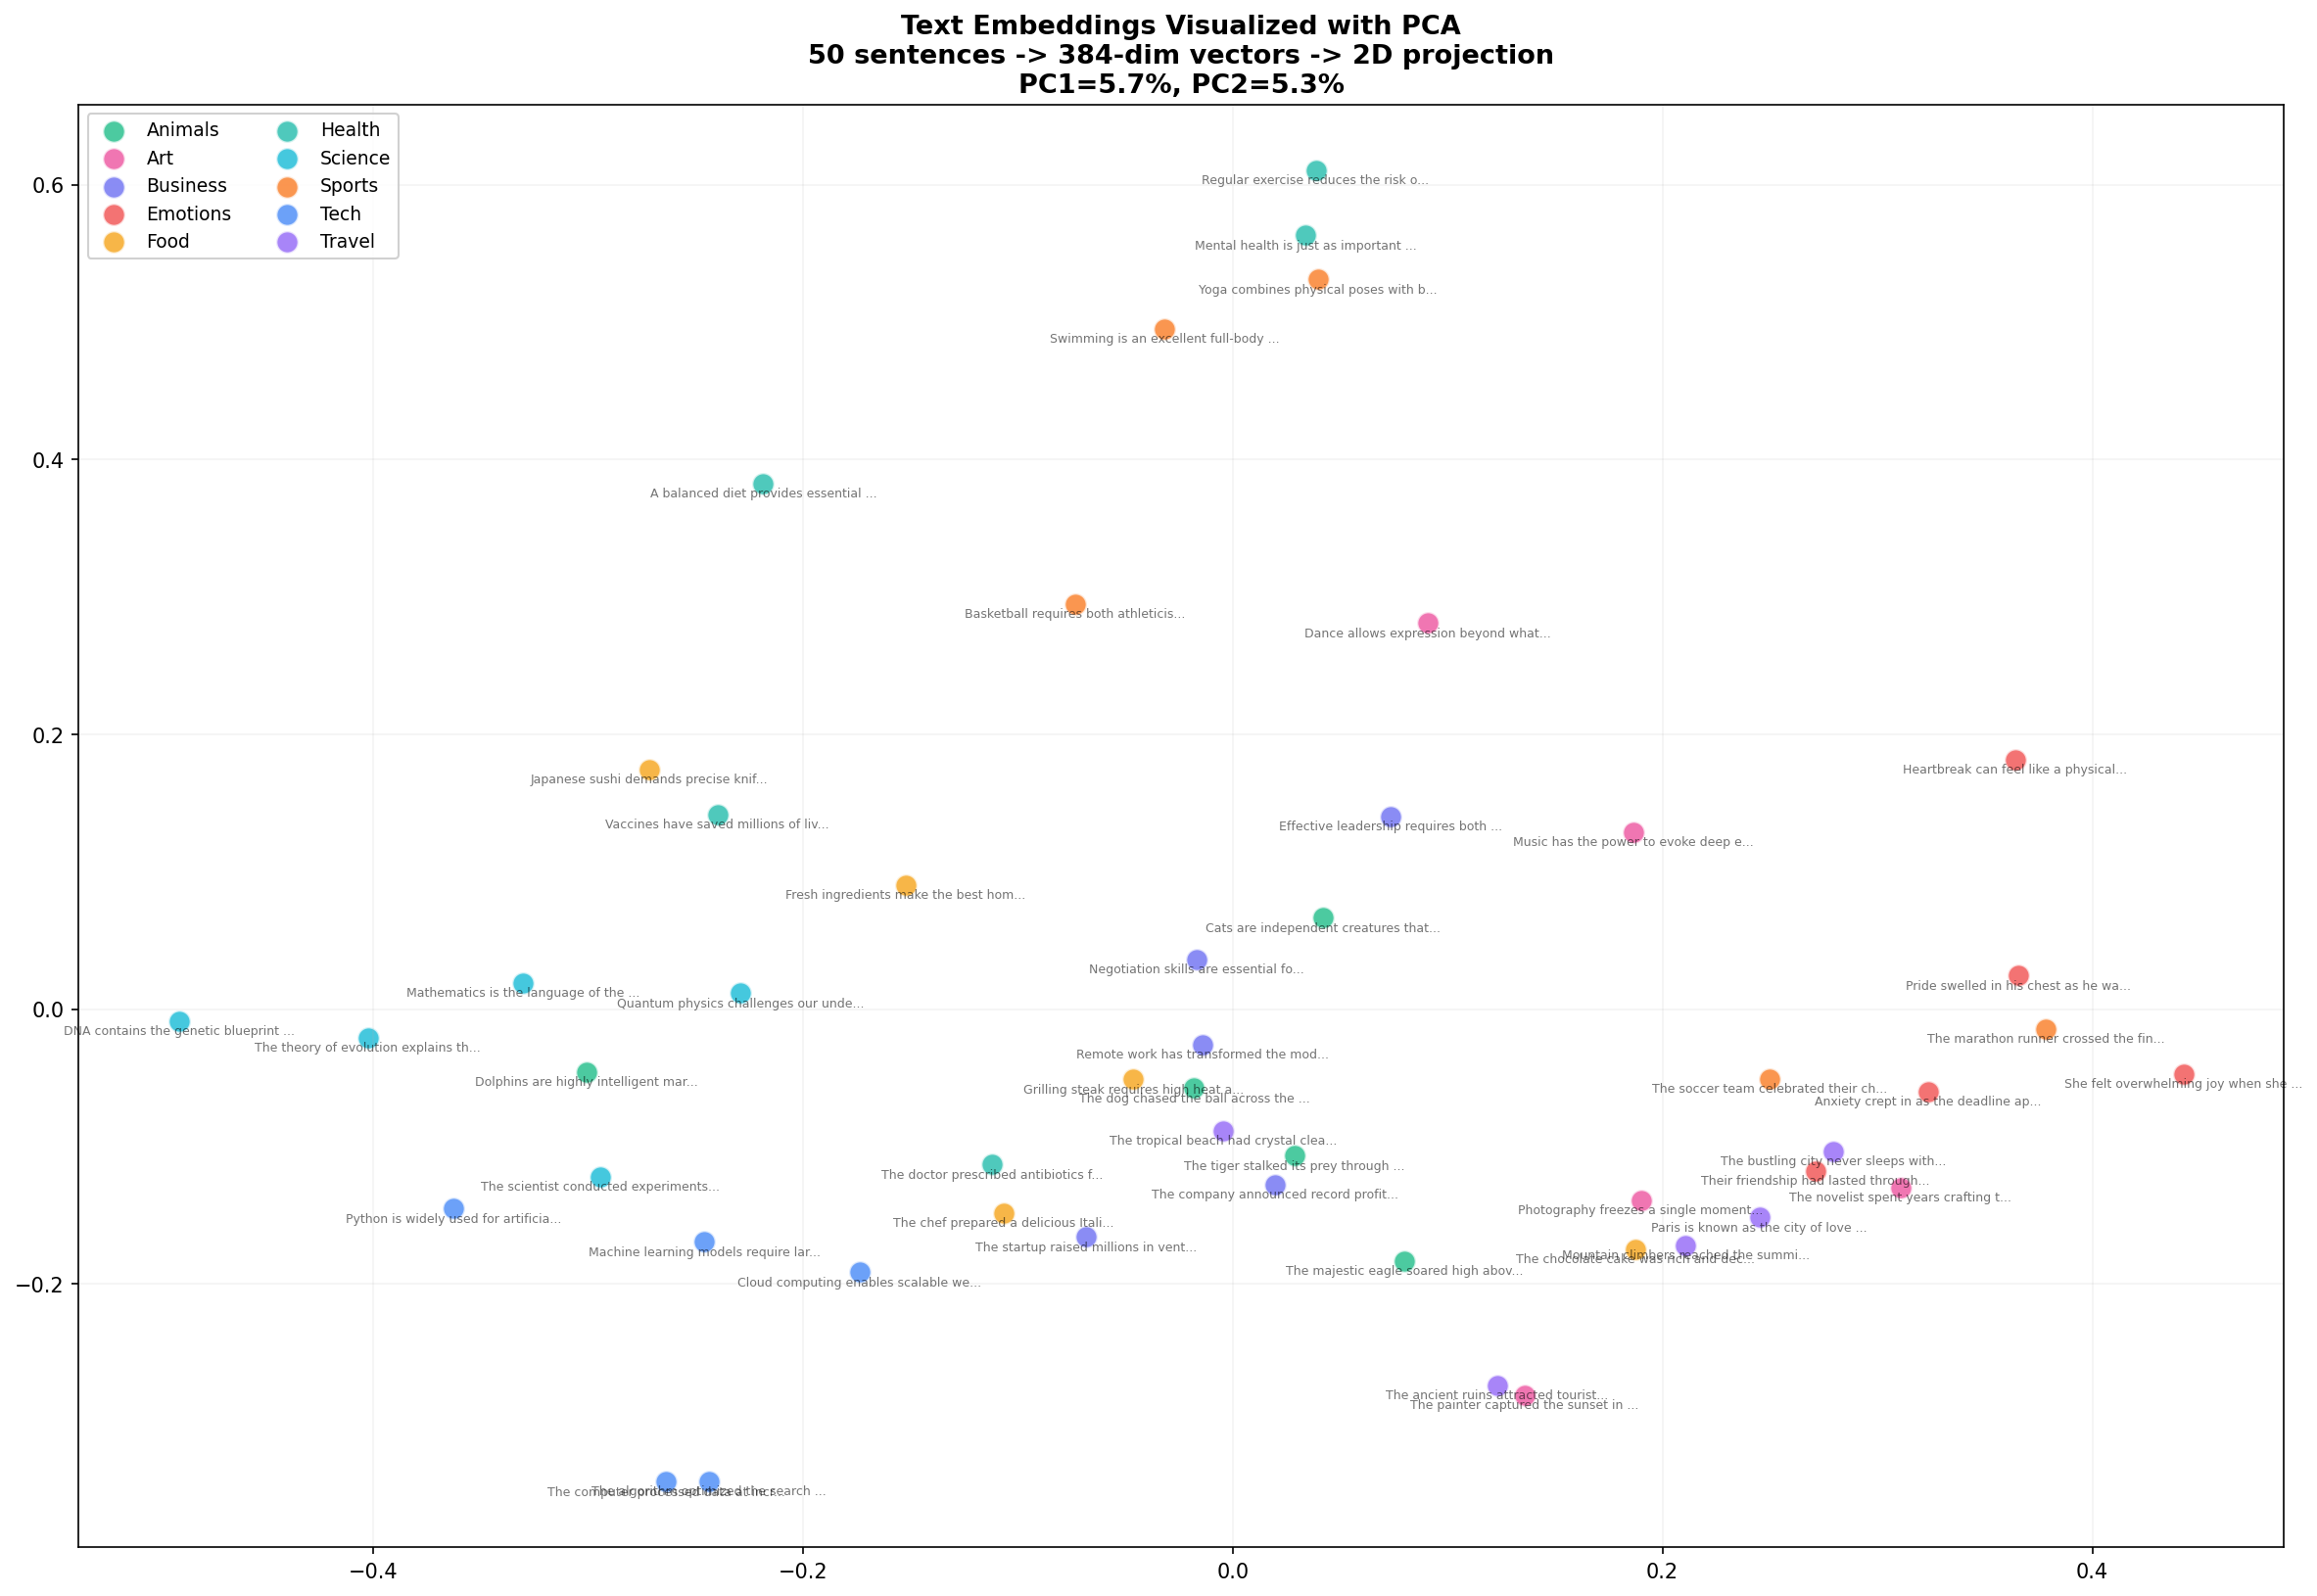
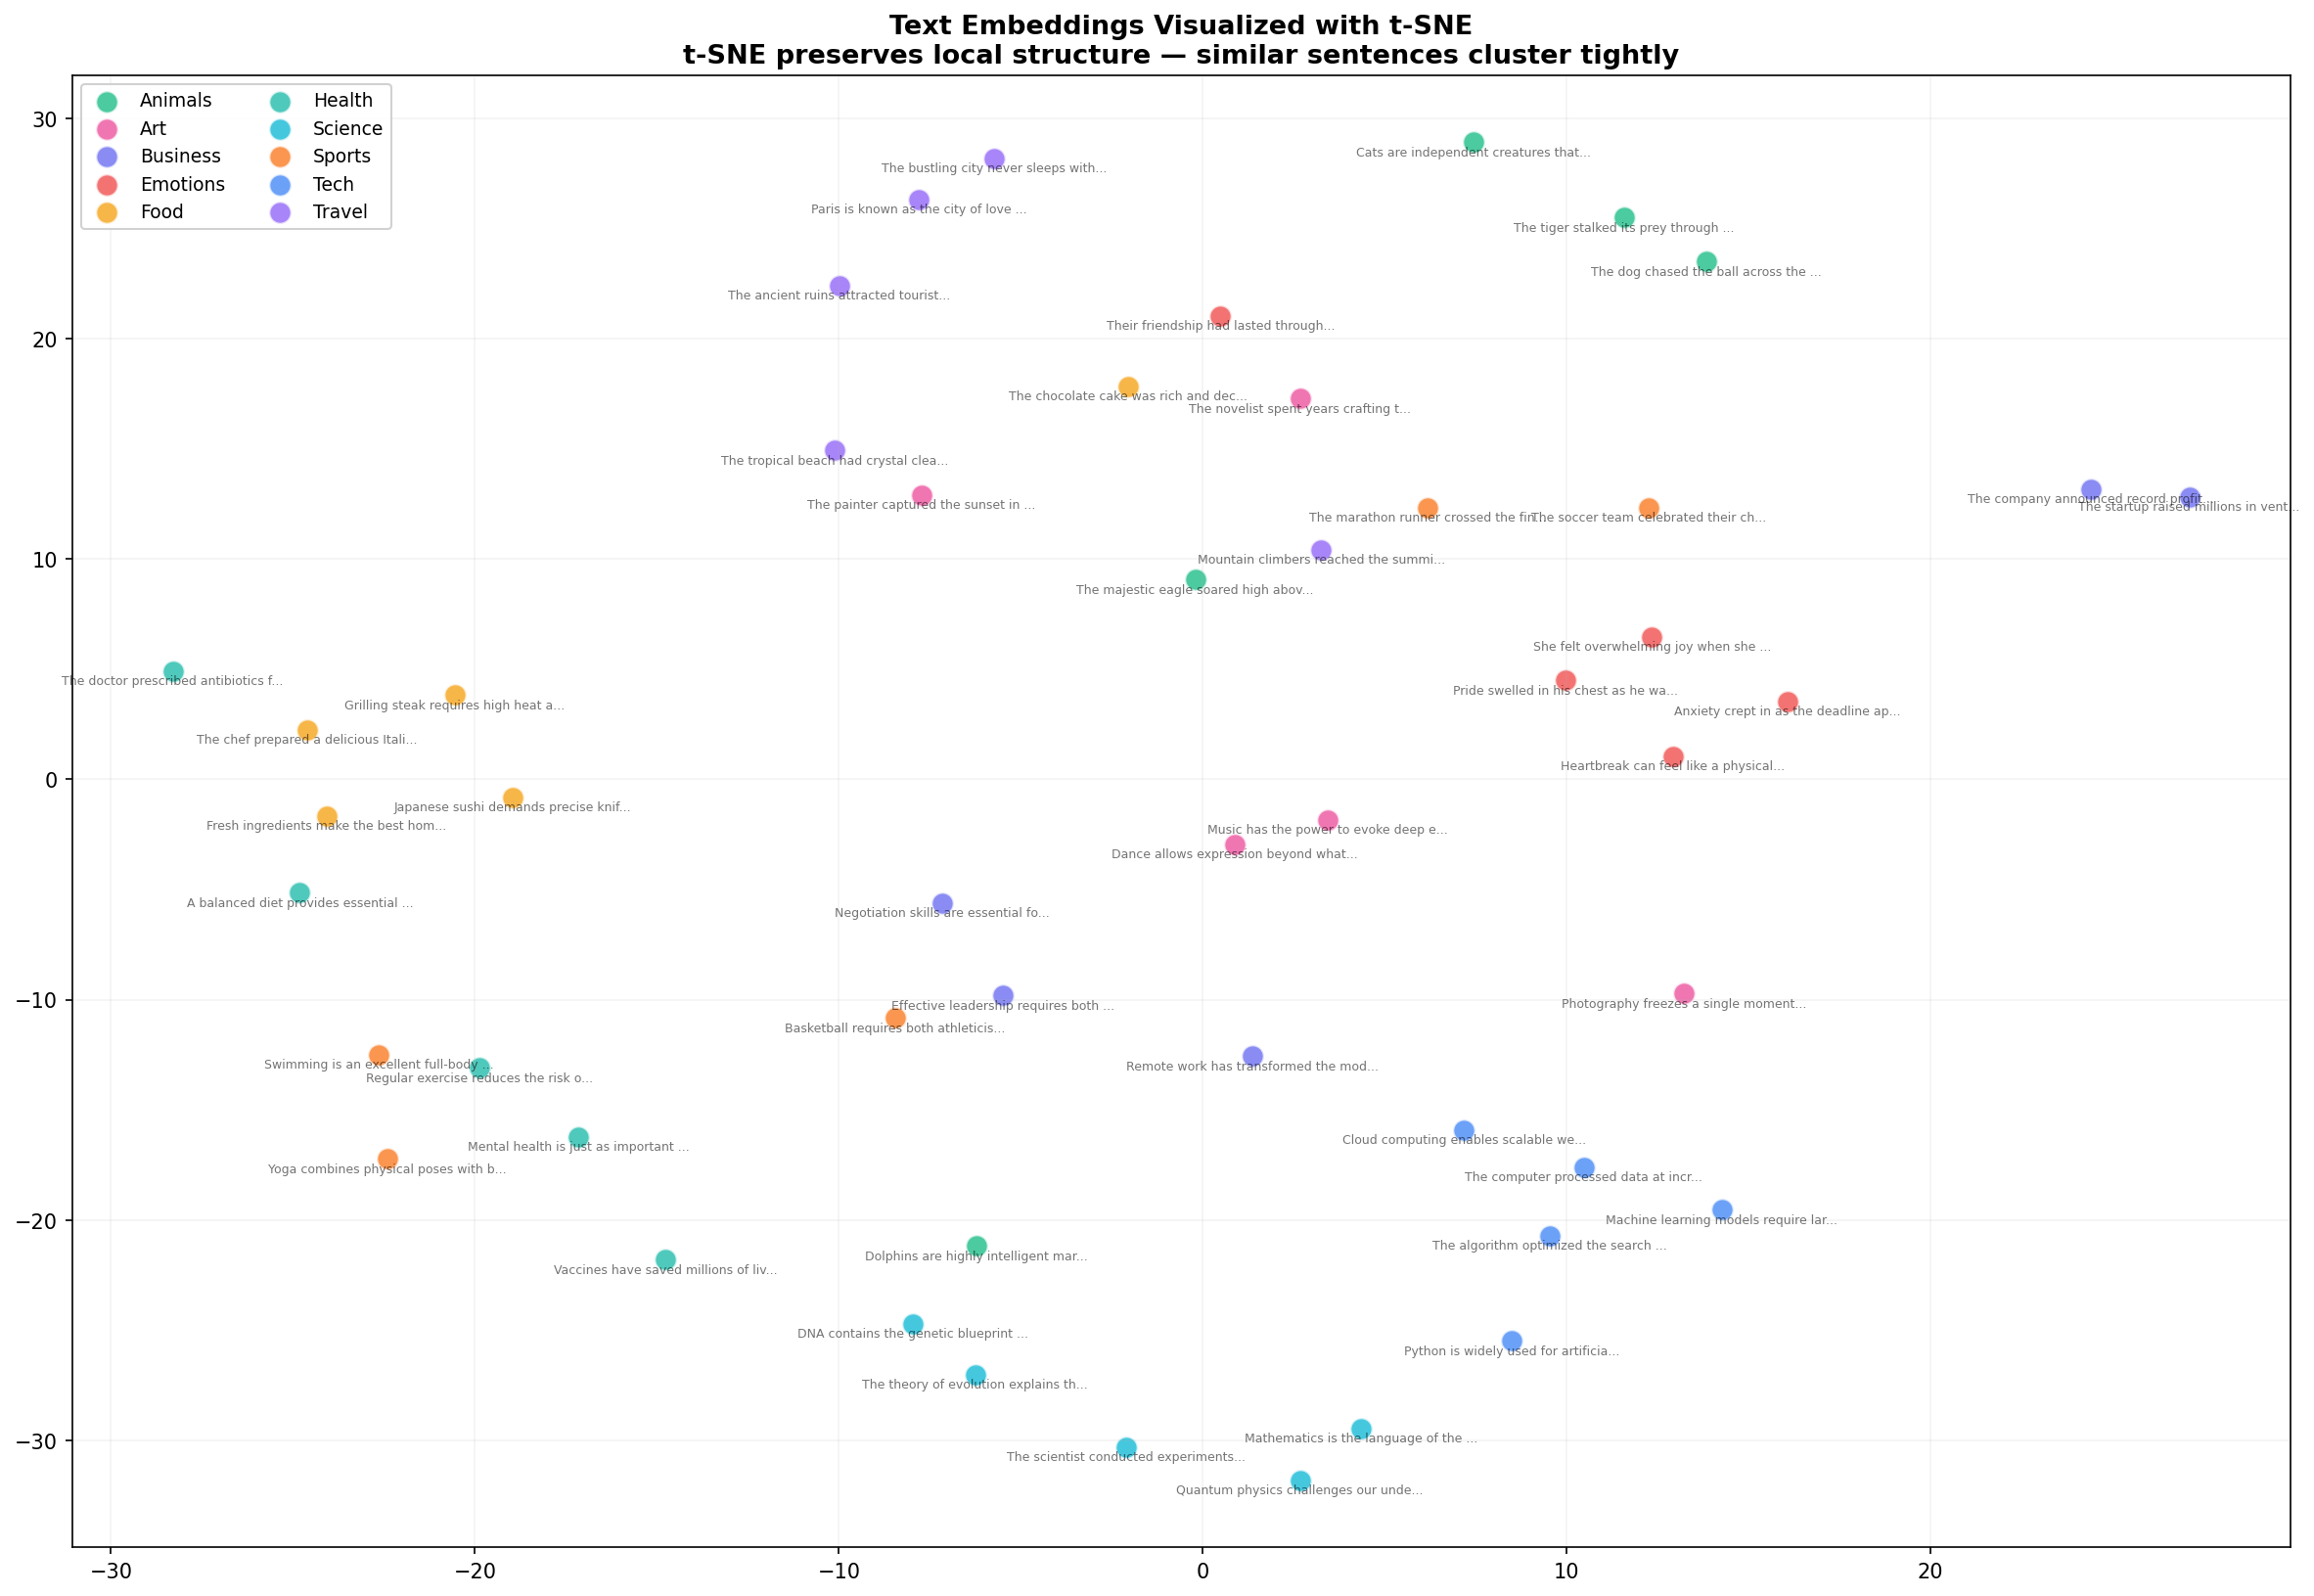
GeezerVison is showing thepythoncode.com — How to Generate and Visualize Text Embeddings in Python - The Python Code Ready to take Python coding to a new level? Explore our Python Code Generator. The perfect tool to get your code up and running in no time. Start now! Take two sentences: "The dog played in the park." Not a single word overlaps. Not one. A keyword search would rate these as completely unrelated. But any human — and any decent language model — immediately recognizes they describe the same thing. The meaning matches, even though the vocabulary doesn't. This ability to capture meaning independent of word choice is what makes text embeddings one of the most important concepts in modern AI. Embeddings are the foundation of semantic search, recommendation systems, chatbots, and retrieval-augmented generation. Yet most developers treat them as a black box — feed text in, get numbers out, hope for the best. In this tutorial, I'll crack that box open. We'll generate embeddings for 50 sentences across 10 categories, compare their semantic similarities, and produce four detailed visualizations — PCA, t-SNE, cosine similarity heatmaps, and dimension analysis — that reveal exactly what embeddings capture and how they work. What Text Embeddings Actually AreAn embedding is a list of numbers that represents what a piece of text means. Not what it says — what it means. The sentence "The dog played in the park" might become a vector like: Each number is a coordinate in a 384-dimensional space (or 768, or 1536 — depends on the model). Sentences with similar meanings end up near each other in this space. "A canine ran through the green field" will be close to "The dog played in the park," while "The stock market crashed yesterday" will be far away. The model that produces these embeddings — in our case, a sentence transformer — was trained on billions of sentence pairs. It learned which sentences are paraphrases of each other and which aren't. That training compressed an enormous amount of linguistic knowledge into those 384 numbers. For more background on how transformer models learn these representations, check out our guide to fine-tuning BERT for text classification, which covers the architecture that makes embeddings possible. Setup: One pip installThat's it. No API keys, no GPU, no Docker. Sentence Transformers runs on CPU and produces quality embeddings in milliseconds per sentence. Step 1: Build a Diverse Sentence CorpusTo understand embeddings, we need sentences that span different topics. I created 50 sentences across 10 categories — Technology, Animals, Food, Travel, Emotions, Science, Sports, Art, Business, and Health. Five sentences per category. Here's a sample: This diversity is critical — it means we'll see distinct clusters in our visualizations, which reveals whether the model is actually capturing semantic categories or just grouping by superficial word overlap. Step 2: Generate EmbeddingsOne function call converts all 50 sentences into vectors: Fifty sentences became fifty vectors of 384 numbers each. The model loaded in about 2 seconds (first run downloads 80MB; subsequent runs use cache), and encoding all 50 sentences took under a second. Why 384 dimensions? The Step 3: Visualize with PCAYou can't visualize 384 dimensions directly, but PCA (Principal Component Analysis) projects them down to 2D while preserving as much structure as possible:
Look at what emerges. Food sentences (yellow) cluster together on the left. Animals (green) form a group in the upper region. Tech and Business (blue, indigo) mix in the lower right — which makes sense, since many tech sentences involve business concepts. PC1 and PC2 together explain about 10% of the variance, which is impressive considering we compressed 384 dimensions into 2. Step 4: Visualize with t-SNEPCA is fast but limited — it can only capture linear relationships. t-SNE is slower but reveals much richer structure by preserving local neighborhoods:
t-SNE reveals what PCA couldn't: tight, well-separated clusters. Health sentences (teal) now form a distinct group. Art sentences (pink) cluster together. The Business and Tech sentences that mixed in PCA are now more clearly separated. This is why t-SNE is the go-to for embedding visualization — it preserves the local structure that matters for semantic similarity. The trade-off: t-SNE is stochastic (different runs produce different layouts) and its axes have no interpretable meaning unlike PCA. Use PCA for quick exploration, t-SNE for publication-quality figures. Step 5: Cosine Similarity HeatmapScatter plots show clusters, but they don't show pairwise similarity. For that, we need a heatmap:
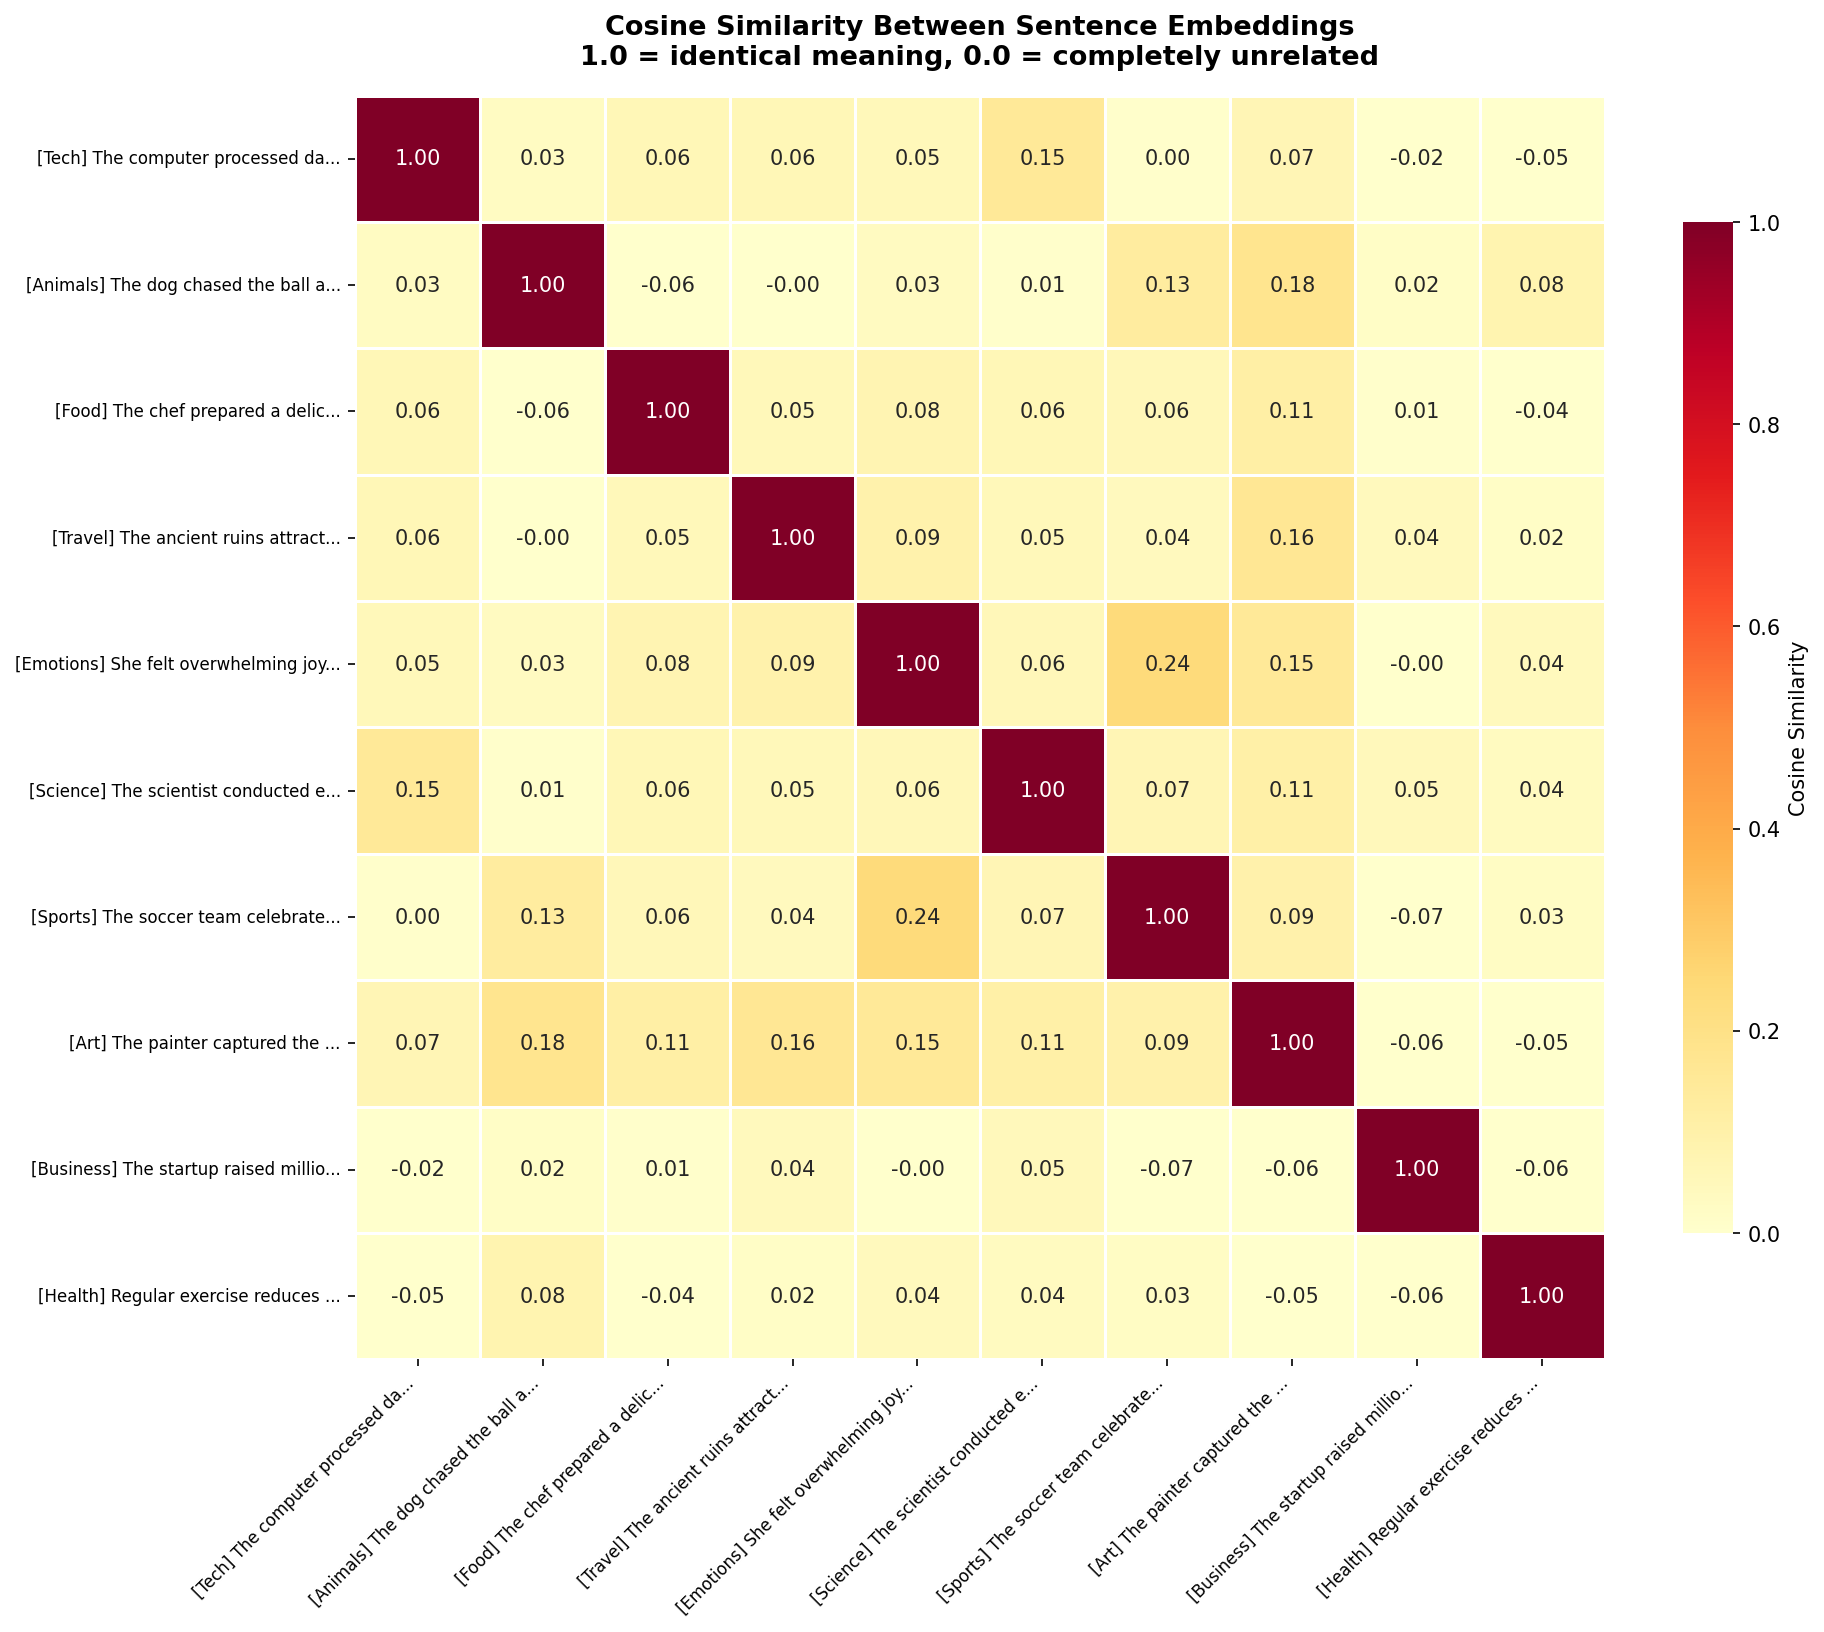
The diagonal is 1.0 — every sentence is perfectly similar to itself. But look at the off-diagonal cells. The Tech sentence (row 1) has 0.36 similarity with Business, 0.19 with Science — moderate, reasonable relationships. Against Food (0.09) and Animals (0.14), the similarity drops near zero. The model correctly identifies which topics are related and which aren't. The heatmap also reveals nuanced relationships. Emotions and Art have a 0.16 similarity — not huge, but notably higher than Emotions vs Sports (0.08). The model has learned that emotional expression and artistic expression share conceptual ground. Step 6: Dimension Distribution AnalysisThose 384 numbers — are they all equally important? Let's analyze how information is distributed across dimensions:
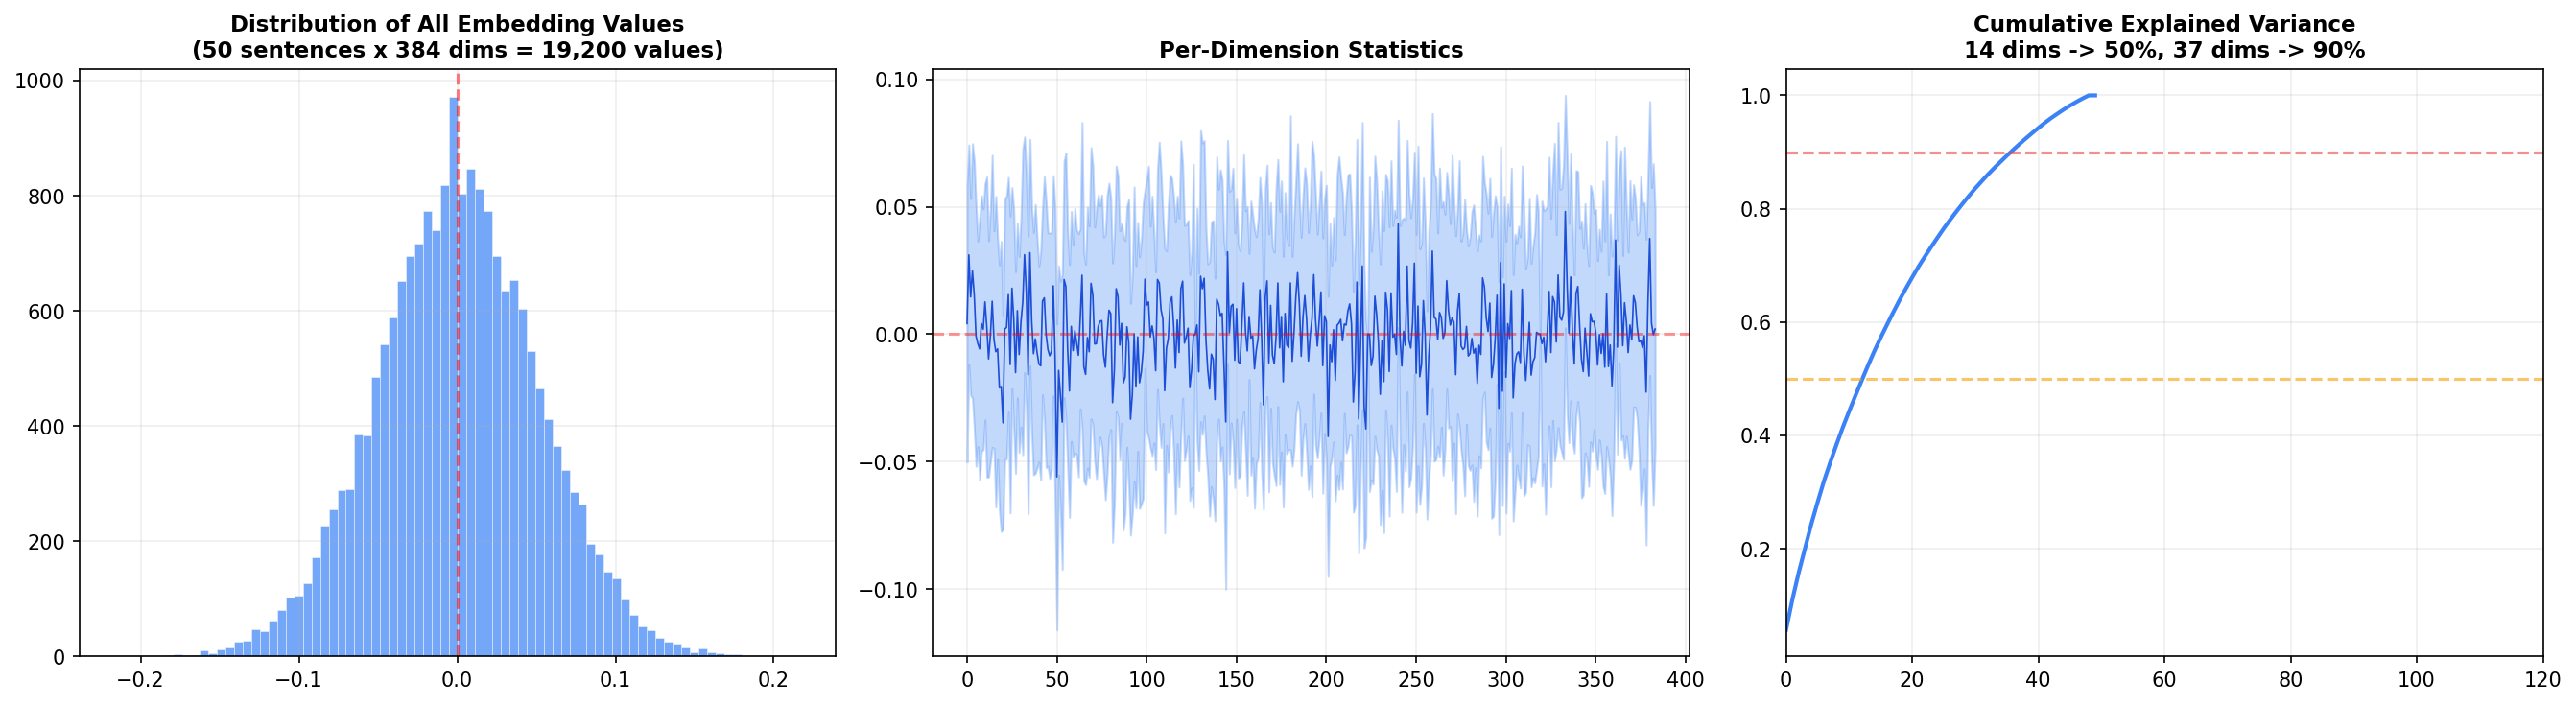
Left panel: The distribution of all 19,200 embedding values (50 sentences × 384 dims) is roughly normal and centered at zero. This is a consequence of L2 normalization — values cluster around zero with a standard deviation around 0.05. Center panel: Each dimension's mean and standard deviation across the 50 sentences. Most dimensions oscillate near zero, but a handful show systematic biases — these are the dimensions that encode broad features like sentence length or overall sentiment. Right panel: The cumulative explained variance — the big insight. 14 dimensions capture 50% of the total variance, and 37 dimensions capture 90%. That means 347 of the 384 dimensions contribute only 10% of the information. Why have all 384? Because that last 10% encodes subtle distinctions — the difference between "happy" and "joyful," or "argued" and "debated." For search and retrieval, those distinctions matter. Semantic Similarity in ActionVisualizations are great, but the real test is whether the model can distinguish meaning from vocabulary. Here are four controlled pairs: Every pair with shared meaning scores above 50%. Every pair with shared words but different meaning scores below 10%. The model even produces negative similarity for the ML-vs-cat pair — indicating the embeddings point in opposite directions. It's not just distinguishing; it's contrasting. Across all 50 sentences, the model found these as its most similar and most different pairs: The most similar pairs are genuinely related concepts across different vocabulary. The most different pair — sushi vs Paris — is almost comically unrelated, and the model correctly places them at opposite ends of the embedding space. How to Use Embeddings in PracticeOnce you have embeddings, you unlock a family of capabilities:
Choosing the Right Embedding Model
For this tutorial I used MiniLM because it's fast, small, and produces embeddings good enough to demonstrate all the concepts. For production semantic search, mpnet-base-v2 is the standard choice — it tops the Sentence Transformers benchmark for semantic similarity tasks. Wrapping UpText embeddings are one of those rare concepts where the core idea is simple — similar meanings map to nearby points — but the implications are profound. Once you internalize that text can be converted to coordinates in a semantic space, you start seeing applications everywhere: search, clustering, recommendation, duplicate detection, retrieval. The visualizations tell the story: PCA shows broad structure, t-SNE reveals tight clusters, heatmaps quantify pairwise similarity, and dimension analysis exposes how information is distributed. Together, they transform embeddings from a black box into something you can see, understand, and trust. The complete code is below. Install the dependencies, drop it in a Further Reading:
Ready for more? Dive deeper into coding with our AI-powered Code Explainer. Don't miss it!
Sharing is caring!
CommentsGot a coding query or need some guidance before you comment? Check out this Python Code Assistant for expert advice and handy tips. It's like having a coding tutor right in your fingertips! | |||||||||||||||||||||||||
| You are visitor 01402503 — GeezerVison does not store the pages you look up. Best viewed with Netscape Navigator 4.7 or Internet Explorer 6 at 800×600. No cookies required. |