GeezerVisonThe World Wide Web, restored to 800 pixels of glory. | ||||||||||||||||||||||||||||||||||||||||||||||||||||||||||||||||||||||||||||||||||||||||||||||||||||||||||||||
| Home|About|Gaming cabinet|Archives|How it works|Starter sites | ||||||||||||||||||||||||||||||||||||||||||||||||||||||||||||||||||||||||||||||||||||||||||||||||||||||||||||||
GeezerVison is showing xdebug.org — Xdebug: Documentation » Development Helpers Development HelpersXdebug's development helpers allow you to get better error messages and
obtain more information from PHP's built-in functions. The helpers
include an upgraded Contents
Improved var_dump() function #
Xdebug changes PHP's built-in HTML ContextWithout Xdebug loaded, and a array(4) {
["one"]=>
string(23) "a somewhat long string!"
["two"]=>
array(1) {
["two.one"]=>
array(2) {
["two.one.zero"]=>
int(210)
["two.one.one"]=>
array(2) {
["two.one.one.zero"]=>
float(3.141592564)
["two.one.one.one"]=>
float(2.7)
}
}
}
["three"]=>
object(test)#1 (3) {
["pub"]=>
*RECURSION*
["priv":"test":private]=>
bool(true)
["prot":protected]=>
int(42)
}
["four"]=>
array(6) {
[0]=>
int(0)
[1]=>
int(1)
[2]=>
int(2)
[3]=>
int(3)
[4]=>
int(4)
[5]=>
int(5)
}
}
With Xdebug loaded, it will output this instead: /tmp/var_dump.php:23:
array (size=4)
'one' => string 'a somewhat long string!' (length=23)
'two' =>
array (size=1)
'two.one' =>
array (size=2)
'two.one.zero' => int 210
'two.one.one' =>
array (size=2)
  ...
'three' =>
object(test)[1]
public 'pub' =>
&object(test)[1]
private 'priv' => boolean true
protected 'prot' => int 42
'four' =>
array (size=6)
0 => int 0
1 => int 1
2 => int 2
3 => int 3
4 => int 4
5 => int 5
The changes are:
There are a number of settings that change control how much output is shown and/or hidden. These settings are:
Command Line
The overloaded That turns: /tmp/var_dump2.php:12:
array(2) {
'one' =>
string(23) "a somewhat long string!"
'three' =>
class test#1 (3) {
public $pub =>
bool(false)
private $priv =>
bool(true)
protected $prot =>
int(42)
}
}
Into: /tmp/var_dump2.php:12:
array(2) {
'one' =>
string(23) "a somewhat long string!"
'three' =>
class test#1 (3) {
public $pub =>
bool(false)
private $priv =>
bool(true)
protected $prot =>
int(42)
}
}
Stack Traces #When Xdebug is loaded, it overrides PHP's standard error handler callbacks, and provides one that also shows a stack trace. These stack traces contain a list of all the functions and method that were called between the start of the script and where the error occurred. An example of such a stack trace is:
This is an example of a stack trace with only some of the optional features
turned on. The "Variables in local scope" section will only show when you set
xdebug.show_local_vars to Here follows a list with settings that change the information that is shown in a stack trace:
Two more settings control whether Xdebug should show stack traces even when an Error or Exception has been caught: You can find more detailed information for each setting in their own documentation section. Filtering #Xdebug includes filtering capabilities for stack traces. A filter either includes, or excludes, paths or class name prefixes (namespaces). You can use a filter to prevent anything from a vendor directory to appear in a stack trace, or to only include classes from specific namespaces. To set-up a filter that shows only functions and methods that either have no class name, or are prefixed with "Xdebug", you would call xdebug_set_filter() with: Filter Example
With this filter set-up, you will only see functions (without class) and all
method calls of classes that start with "Xdebug". This includes built-in PHP
functions (such as The full documentation for the arguments to xdebug_set_filter() are described on its own documentation page. Related Settings and Functions #
Settings #integer xdebug.cli_color = 0 #If this setting is 1, Xdebug will color var_dumps and stack traces output when in CLI mode and when the output is a tty. On Windows, the ANSICON tool needs to be installed. If the setting is 2, then Xdebug will always color var_dumps and stack trace, no matter whether it's connected to a tty or whether ANSICON is installed. In this case, you might end up seeing escape codes. See this article for some more information. This setting can additionally be configured through the
string xdebug.dump.* = Empty #* can be any of COOKIE, FILES, GET, POST, REQUEST, SERVER, SESSION. These seven settings control which data from the superglobals is shown when an error situation occurs. Each of those php.ini setting can consist of a comma separated list of
variables from this superglobal to dump, or In order to dump the REMOTE_ADDR and the REQUEST_METHOD when an error occurs, and all GET parameters, add these settings: xdebug.dump.SERVER = REMOTE_ADDR,REQUEST_METHOD xdebug.dump.GET = * boolean xdebug.dump_globals = true #When this setting is set to boolean xdebug.dump_once = true #Controls whether the values of the superglobals should be dumped on all error situations (set to 0) or only on the first (set to 1). boolean xdebug.dump_undefined = false #If you want to dump undefined values from the superglobals you should set this setting to 1, otherwise leave it set to 0. string xdebug.file_link_format = #This setting determines the format of the links that are made in the display of stack traces where file names are used. This allows IDEs to set up a link-protocol that makes it possible to go directly to a line and file by clicking on the filenames that Xdebug shows in stack traces. An example format might look like: myide://%f@%l The possible format specifiers are:
For various IDEs/OSses there are some instructions listed on how to make this work: PhpStormIn the configuration file, add the following line, including the single quotes. This uses PhpStorm's REST API. xdebug.file_link_format='javascript: var r = new XMLHttpRequest; r.open("get", "http://localhost:63342/api/file/%f:%l");r.send()'
Firefox on Linux
Windows and Netbeans
string xdebug.filename_format = ...%s%n #This setting determines the format with which Xdebug renders
filenames in HTML stack traces (default:
The possible format specifiers are listed in this table. The example output is
rendered according to the full path
integer xdebug.force_display_errors = 0 #If this setting is set to integer xdebug.force_error_reporting = 0 #This setting is a bitmask, like error_reporting. This bitmask will be logically ORed with the bitmask represented by error_reporting to dermine which errors should be displayed. This setting can only be made in php.ini and allows you to force certain errors from being shown no matter what an application does with ini_set(). integer xdebug.halt_level = 0 #This setting allows you to configure a mask that determines whether, and which, notices and/or warnings get converted to errors. You can configure notices and warnings that are generated by PHP, and notices and warnings that you generate yourself (by means of trigger_error()). For example, to convert the warning of strlen() (without arguments) to an error, you would do: ini_set('xdebug.halt_level', E_WARNING);
strlen();
echo "Hi!\n";
Which will then result in the showing of the error message, and the abortion
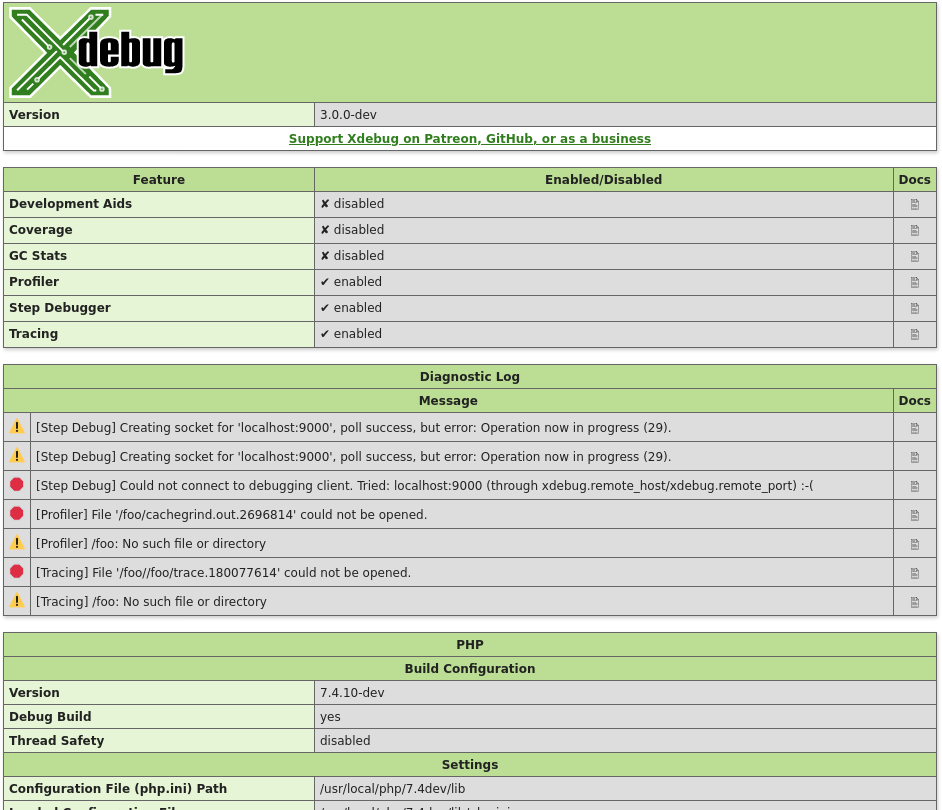
of the script. The setting is a bit mask, so to convert all notices and warnings into errors for all applications, you can set this in php.ini: xdebug.halt_level=E_WARNING|E_NOTICE|E_USER_WARNING|E_USER_NOTICE The bitmask only supports the four level that are mentioned above. string xdebug.log = #Configures Xdebug's log file. Xdebug will log to this file all file creations issues, Step Debugging connection attempts, failures, and debug communication. Enable this functionality by setting the value to a absolute path. Make sure
that the system user that PHP runs at (such as The file is opened in append-mode, and will therefore not be overwritten by default. There is no concurrency protection available. The log file will include any attempt that Xdebug makes to connect to an IDE: [2693358] Log opened at 2020-09-02 07:19:09.616195 [2693358] [Step Debug] INFO: Connecting to configured address/port: localhost:9003. [2693358] [Step Debug] ERR: Could not connect to debugging client. Tried: localhost:9003 (through xdebug.client_host/xdebug.client_port). [2693358] [Profiler] ERR: File '/foo/cachegrind.out.2693358' could not be opened. [2693358] [Profiler] WARN: /foo: No such file or directory [2693358] [Tracing] ERR: File '/foo/trace.1485761369' could not be opened. [2693358] [Tracing] WARN: /foo: No such file or directory [2693358] Log closed at 2020-09-02 07:19:09.617510 It includes the opening time ( It includes:
For Step Debugging: INFO: Connecting to configured address/port: localhost:9003. ERR: Could not connect to debugging client. Tried: localhost:9003 (through xdebug.client_host/xdebug.client_port). For Profiling: ERR: File '/foo/cachegrind.out.2693358' could not be opened. WARN: /foo: No such file or directory For Function Trace and Flame Graphs: ERR: File '/foo/trace.1485761369' could not be opened. WARN: /foo: No such file or directory All warnings and errors are described on the Description of errors page, with
detailed instructions on how to resolve the problem, if possible. All errors are always logged through
PHP's internal logging mechanism (configured with error_log
in Step Debugger CommunicationThe debugging log can also log the communication between Xdebug and an IDE.
This communication is in XML, and starts with the <init
xmlns="urn:debugger_protocol_v1" xmlns:xdebug="https://xdebug.org/dbgp/xdebug"
fileuri="file:///home/httpd/www.xdebug.org/html/router.php"
language="PHP" xdebug:language_version="7.4.11-dev"
protocol_version="1.0" appid="2693358" idekey="XDEBUG_ECLIPSE">
<engine version="3.0.0-dev"><![CDATA[Xdebug]]></engine>
<author><![CDATA[Derick Rethans]]></author>
<url><![CDATA[https://xdebug.org]]></url>
<copyright><![CDATA[Copyright (c) 2002-2020 by Derick Rethans]]></copyright>
</init>
The Beyond the <- feature_set -i 4 -n extended_properties -v 1
-> <response
xmlns="urn:debugger_protocol_v1" xmlns:xdebug="https://xdebug.org/dbgp/xdebug"
command="feature_set" transaction_id="4" feature="extended_properties" success="1">
</response>
<- step_into -i 9
-> <response
       xmlns="urn:debugger_protocol_v1" xmlns:xdebug="https://xdebug.org/dbgp/xdebug"
       command="step_into" transaction_id="9"
       status="break" reason="ok">
           <xdebug:message filename="file:///home/httpd/www.xdebug.org/html/router.php" lineno="3">
           </xdebug:message>
   </response>
You can read about DBGP - A common debugger protocol specification at its dedicated documation page. The xdebug.log_level setting controls how much information is logged. Many Linux distributions now use systemd, which
implements private tmp directories. This means that when PHP
is run through a web server or as PHP-FPM, the This setting can additionally be configured through the
integer xdebug.log_level = 7 #Configures which logging messages should be added to the log file. The log file is configured with the xdebug.log setting. The following levels are supported:
Criticals, errors, and warnings always show up in the diagnostics log that you can view by calling xdebug_info(). Criticals and errors are additionally logged through
PHP's internal logging mechanism (configured with error_log
in This setting can additionally be configured through the
integer xdebug.max_nesting_level = 512 #Controls the protection mechanism for infinite recursion protection. The value of this setting is the maximum level of nested functions that are allowed before the script will be aborted. When the maximum nesting level is reached, an "Error" exception is thrown. Before Xdebug 3.3, the default value was integer xdebug.max_stack_frames = -1 #Controls how many stack frames are shown in stack traces, both on the command line during PHP error stack traces, as well as in the browser for HTML traces. string xdebug.mode = develop #This setting controls which Xdebug features are enabled. This setting can only be set in The following values are accepted:
You can enable multiple modes at the same time by comma separating their
identifiers as value to xdebug.mode: XDEBUG_MODE environment variableYou can also set Xdebug's mode by setting the Some web servers have a configuration option to
prevent environment variables from being propagated to PHP and Xdebug.
boolean xdebug.scream = false #If this setting is 1, then Xdebug will disable the @ (shut-up) operator so that notices, warnings and errors are no longer hidden. integer xdebug.show_error_trace = 0 #When this setting is set to 1, Xdebug will show a stack trace whenever an Error is raised - even if this Error is actually caught. integer xdebug.show_exception_trace = 0 #When this setting is set to 1, Xdebug will show a stack trace whenever an Exception or Error is raised - even if this Exception or Error is actually caught. Error 'exceptions' were introduced in PHP 7. integer xdebug.show_local_vars = 0 #When this setting is set to something != 0 Xdebug's generated stack dumps in error situations will also show all variables in the top-most scope. Beware that this might generate a lot of information, and is therefore turned off by default. string xdebug.trigger_value = "" #This setting can be used when xdebug.start_with_request is set to
In The legacy names Normally, Xdebug does not look at which value is actually used. If this setting is set to a non-empty string, then Xdebug will only trigger if the value matches the value of this setting. With the following settings: xdebug.mode=profile xdebug.start_with_request=trigger xdebug.trigger_value=StartProfileForMe Xdebug's profiler will only start when either the environment variable
From Xdebug 3.1, it is possible to configure multiple values by using a comma separated list. In that case, Xdebug will trigger if the supplied value matches any of the entries that are configured through this setting: xdebug.trigger_value=StartDebuggerForMe,StartDebuggerForYou See also:
integer xdebug.var_display_max_children = 128 #Controls the amount of array children and object's properties are shown when variables are displayed with either xdebug_var_dump(), xdebug.show_local_vars or when making a Function Trace. To disable any limitation, use -1 as value. This setting does not have any influence on the number of children that is send to the client through the Step Debugging feature. integer xdebug.var_display_max_data = 512 #Controls the maximum string length that is shown when variables are displayed with either xdebug_var_dump(), xdebug.show_local_vars or when making a Function Trace. To disable any limitation, use -1 as value. This setting does not have any influence on the number of children that is send to the client through the Step Debugging feature. integer xdebug.var_display_max_depth = 3 #Controls how many nested levels of array elements and object properties are when variables are displayed with either xdebug_var_dump(), xdebug.show_local_vars or when making a Function Trace. The maximum value you can select is 1023. You can also use -1 as value to select this maximum number. This setting does not have any influence on the number of children that is send to the client through the Step Debugging feature. Setting the value to a high number could potentially result in PHP using up all the available memory, so use with caution. Functions #var_dump( mixed ...$var ) : void #Displays detailed information about a variable This function is overloaded by Xdebug, see the description for xdebug_var_dump(). xdebug_call_class( int $depth = 2 ) : mixed #Returns the calling class
This function returns the name of the class that defined the current method,
Example:Returns:Called @ /home/httpd/html/test/xdebug_caller.php:17 from ::{main}
To retrieve information from earlier stack frames, use the optional
Example:Returns:Strings::fix_string is called at /home/httpd/html/test/xdebug_caller:17
A value of Example:Returns:Strings::fix_strings is called at /home/httpd/html/test/xdebug_caller:25
A value of Example:Returns:::xdebug_call_function is called at /home/httpd/html/test/xdebug_caller:13 xdebug_call_file( int $depth = 2 ) : mixed #Returns the calling file
This function returns the filename from where the current function/method
was executed from, or
To retrieve information from earlier stack frames, use the optional
For examples and more extensive information, see xdebug_call_class(). xdebug_call_function( int $depth = 2 ) : mixed #Returns the calling function/method
This function returns the name of the current function/method,
To retrieve information from earlier stack frames, use the optional
For examples and more extensive information, see xdebug_call_class(). xdebug_call_line( int $depth = 2 ) : mixed #Returns the calling line number
This function returns the line number from where the current function/method was
called from, or
To retrieve information from earlier stack frames, use the optional
For examples and more extensive information, see xdebug_call_class(). xdebug_debug_zval( string ...$varname ) : void #Displays information about a variable This function displays structured information about one or more variables that includes its type, value and refcount information. Arrays are explored recursively with values. This function is implemented differently from PHP's debug_zval_dump() function in order to work around the problems that that function has because the variable itself is actually passed to the function. Xdebug's version is better as it uses the variable name to lookup the variable in the internal symbol table and accesses all the properties directly without having to deal with actually passing a variable to a function. The result is that the information that this function returns is much more accurate than PHP's own function for showing zval information. Support for anything but simple variable names (such as "a[2]" below) is supported since Xdebug 2.3. Example:Returns:a: (refcount=2, is_ref=1)=array ( 0 => (refcount=1, is_ref=0)=1, 1 => (refcount=1, is_ref=0)=2, 2 => (refcount=2, is_ref=1)=3) a[2]: (refcount=2, is_ref=1)=3 xdebug_debug_zval_stdout( string ...$varname ) : void #Returns information about variables to stdout This function displays structured information about one or more variables that includes its type, value and refcount information. Arrays are explored recursively with values. The difference with xdebug_debug_zval() is that the information is not displayed through a web server API layer, but directly shown on stdout (so that when you run it with Apache in single process mode it ends up on the console). Example:Returns:a: (refcount=2, is_ref=1)=array ( 0 => (refcount=1, is_ref=0)=1, 1 => (refcount=1, is_ref=0)=2, 2 => (refcount=2, is_ref=1)=3) xdebug_dump_superglobals() : void #Displays information about super globals This function dumps the values of the elements of the super globals as specified with the xdebug.dump.* php.ini settings. For the example below the settings in php.ini are: Example:Returns:
xdebug_get_collected_errors( bool $emptyList = false ) : array #Returns all collected error messages This function returns all errors from the collection buffer that contains all errors that were stored there when error collection was started with xdebug_start_error_collection().
By default this function will not clear the error collection buffer. If you pass
This function returns a string containing all collected errors formatted as an "Xdebug table". xdebug_get_function_count() : int #Returns the number of functions that have been called This function returns the number of functions that have been called so far, including this function itself. xdebug_get_headers() : array #Returns all the headers as set by calls to PHP's header() function Returns all the headers that are set with PHP's header() function, or any other header set internally within PHP (such as through setcookie()), as an array. Example:Returns:array(2) {
[0]=>
string(6) "X-Test"
[1]=>
string(33) "Set-Cookie: TestCookie=test-value"
}xdebug_info( ?string $category = null ) : mixed #Show and retrieve diagnostic information This function presents APIs to retrieve information about Xdebug itself. Which information gets returned, or displayed, depends on which arguments, or none at all, are given.
| ||||||||||||||||||||||||||||||||||||||||||||||||||||||||||||||||||||||||||||||||||||||||||||||||||||||||||||||
| You are visitor 01402503 — GeezerVison does not store the pages you look up. Best viewed with Netscape Navigator 4.7 or Internet Explorer 6 at 800×600. No cookies required. | ||||||||||||||||||||||||||||||||||||||||||||||||||||||||||||||||||||||||||||||||||||||||||||||||||||||||||||||