GeezerVisonThe World Wide Web, restored to 800 pixels of glory. | |||||||||||||||||||||
| Home|About|Gaming cabinet|Archives|How it works|Starter sites | |||||||||||||||||||||
GeezerVison is showing xdebug.org — Xdebug: Documentation » Code Coverage Analysis Code Coverage AnalysisCode coverage tells you which lines of script (or set of scripts) have been executed during a request. With this information you can for example find out how good your unit tests are. Xdebug's code coverage functionality is often used in combination with PHP_CodeCoverage as part of PHPUnit runs. PHPUnit delegates the code coverage collection to Xdebug. It starts and stops code coverage through xdebug_start_code_coverage() and xdebug_stop_code_coverage() for every test, and uses xdebug_get_code_coverage() to retrieve the results. Code coverage's main output is an array detailing which lines in which files have been "hit" while running the code with code coverage collection active. But the code coverage functionality can also, with an additional performance impact, analyse which lines of code have executable code on it, which lines of code can actually be hit (dead code analysis), and also can it do instrumentation to find out which branches and paths in functions and methods have been followed. The various options are documented with the xdebug_start_code_coverage() function. Filtering #
Xdebug 2.6 introduces filtering capabilities for code coverage. With a filter
you can include, or exclude, paths or class name prefixes (namespaces) from
being analysed during code coverage collection. A
typyical use case would be to configure the filter to only include your
The filter works by tagging each executable unit (function, method, file) according to the configured filter. Xdebug can only do that the first time a specific executable unit is included/required, as the filtering happens when PHP parses and compiles a file for the first time. Xdebug needs to do it as this point, as this is also when it analyses which paths can run, and which lines of an executable unit can not be executed. Tagging executable units at this point, also means that the filter does not have to run every time Xdebug wants to count a line to be included in code coverage for example. It is therefore important to set-up the filter before the code is included/required. This currently can be best done through an auto-prepended file through PHP's auto_prepend_file setting.
To set-up a filter that only does code coverage analysis for the
Example:
With this filter set up, the code coverage information will only include
functions, methods and files which are located in the php -dauto_prepend_file=xdebug_filter.php yourscript.php Or in combination with PHPUnit, when installed through Composer, with: php -dauto_prepend_file=xdebug_filter.php vendor/bin/phpunit The full documentation for the arguments to xdebug_set_filter() are described on its own documentation page. Related Content #
Related Settings and Functions #
Settings #string xdebug.log = #Configures Xdebug's log file. Xdebug will log to this file all file creations issues, Step Debugging connection attempts, failures, and debug communication. Enable this functionality by setting the value to a absolute path. Make sure
that the system user that PHP runs at (such as The file is opened in append-mode, and will therefore not be overwritten by default. There is no concurrency protection available. The log file will include any attempt that Xdebug makes to connect to an IDE: [2693358] Log opened at 2020-09-02 07:19:09.616195 [2693358] [Step Debug] INFO: Connecting to configured address/port: localhost:9003. [2693358] [Step Debug] ERR: Could not connect to debugging client. Tried: localhost:9003 (through xdebug.client_host/xdebug.client_port). [2693358] [Profiler] ERR: File '/foo/cachegrind.out.2693358' could not be opened. [2693358] [Profiler] WARN: /foo: No such file or directory [2693358] [Tracing] ERR: File '/foo/trace.1485761369' could not be opened. [2693358] [Tracing] WARN: /foo: No such file or directory [2693358] Log closed at 2020-09-02 07:19:09.617510 It includes the opening time ( It includes:
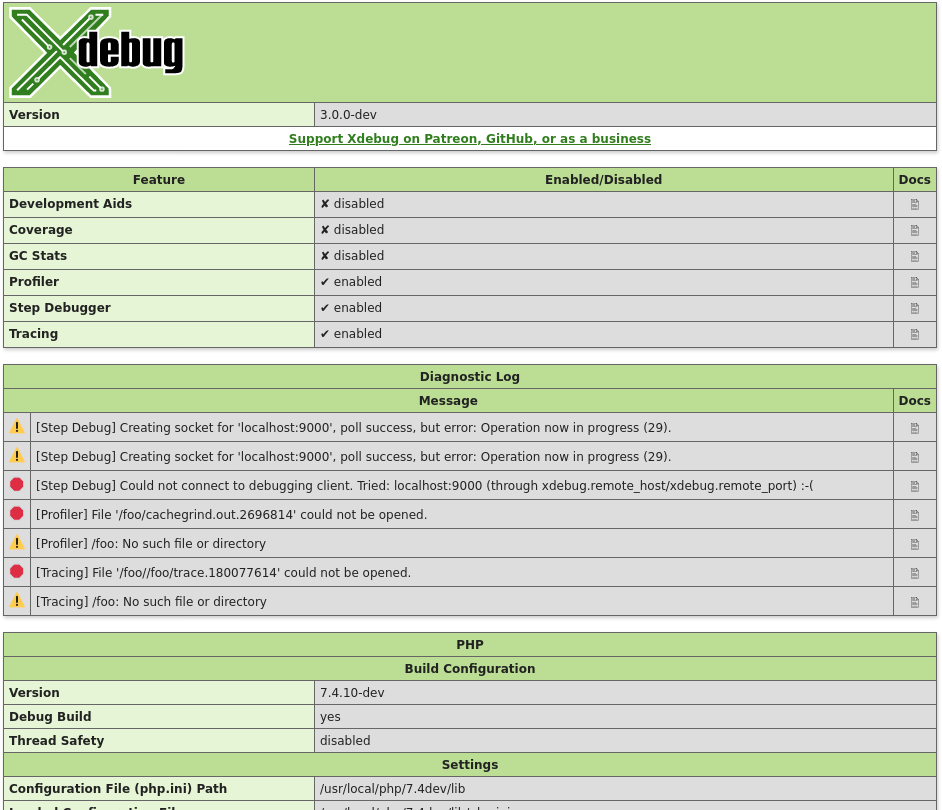
For Step Debugging: INFO: Connecting to configured address/port: localhost:9003. ERR: Could not connect to debugging client. Tried: localhost:9003 (through xdebug.client_host/xdebug.client_port). For Profiling: ERR: File '/foo/cachegrind.out.2693358' could not be opened. WARN: /foo: No such file or directory For Function Trace and Flame Graphs: ERR: File '/foo/trace.1485761369' could not be opened. WARN: /foo: No such file or directory All warnings and errors are described on the Description of errors page, with
detailed instructions on how to resolve the problem, if possible. All errors are always logged through
PHP's internal logging mechanism (configured with error_log
in Step Debugger CommunicationThe debugging log can also log the communication between Xdebug and an IDE.
This communication is in XML, and starts with the <init
xmlns="urn:debugger_protocol_v1" xmlns:xdebug="https://xdebug.org/dbgp/xdebug"
fileuri="file:///home/httpd/www.xdebug.org/html/router.php"
language="PHP" xdebug:language_version="7.4.11-dev"
protocol_version="1.0" appid="2693358" idekey="XDEBUG_ECLIPSE">
<engine version="3.0.0-dev"><![CDATA[Xdebug]]></engine>
<author><![CDATA[Derick Rethans]]></author>
<url><![CDATA[https://xdebug.org]]></url>
<copyright><![CDATA[Copyright (c) 2002-2020 by Derick Rethans]]></copyright>
</init>
The Beyond the <- feature_set -i 4 -n extended_properties -v 1
-> <response
xmlns="urn:debugger_protocol_v1" xmlns:xdebug="https://xdebug.org/dbgp/xdebug"
command="feature_set" transaction_id="4" feature="extended_properties" success="1">
</response>
<- step_into -i 9
-> <response
       xmlns="urn:debugger_protocol_v1" xmlns:xdebug="https://xdebug.org/dbgp/xdebug"
       command="step_into" transaction_id="9"
       status="break" reason="ok">
           <xdebug:message filename="file:///home/httpd/www.xdebug.org/html/router.php" lineno="3">
           </xdebug:message>
   </response>
You can read about DBGP - A common debugger protocol specification at its dedicated documation page. The xdebug.log_level setting controls how much information is logged. Many Linux distributions now use systemd, which
implements private tmp directories. This means that when PHP
is run through a web server or as PHP-FPM, the This setting can additionally be configured through the
integer xdebug.log_level = 7 #Configures which logging messages should be added to the log file. The log file is configured with the xdebug.log setting. The following levels are supported:
Criticals, errors, and warnings always show up in the diagnostics log that you can view by calling xdebug_info(). Criticals and errors are additionally logged through
PHP's internal logging mechanism (configured with error_log
in This setting can additionally be configured through the
string xdebug.mode = develop #This setting controls which Xdebug features are enabled. This setting can only be set in The following values are accepted:
You can enable multiple modes at the same time by comma separating their
identifiers as value to xdebug.mode: XDEBUG_MODE environment variableYou can also set Xdebug's mode by setting the Some web servers have a configuration option to
prevent environment variables from being propagated to PHP and Xdebug.
Functions #xdebug_code_coverage_started() : bool #Returns whether code coverage is active Returns whether code coverage has been started. Example:Returns:bool(false) bool(true) xdebug_get_code_coverage() : array #Returns code coverage information Returns a structure which contains information about which lines were executed in your script (including include files). The following example shows code coverage for one specific file: Example:Returns:array
'/home/httpd/html/test/xdebug/docs/xdebug_get_code_coverage.php' =>
array (size=11)
5 => int 1
6 => int -2
7 => int -2
10 => int 1
11 => int -1
13 => int 1
14 => int 1
16 => int 1
18 => int 1
19 => int 1
21 => int 1The information that is collected consists of an two dimensional array with as primary index the executed filename and as secondary key the line number. The value in the elements represents whether the line has been executed or whether it has unreachable lines. The returned values for each line are:
-1 is only returned when the XDEBUG_CC_UNUSED
is enabled and value -2 is only returned when both
XDEBUG_CC_UNUSED and XDEBUG_CC_DEAD_CODE are enabled
when starting Code Coverage Analysis through xdebug_start_code_coverage().
If path and branch checking has been enabled with the
The following example illustrates that. Example:Returns:array (size=1)
'/tmp/foo2.php' =>
array (size=2)
'lines' =>
array (size=5)
5 => int 1
6 => int 1
8 => int 1
10 => int 1
12 => int 1
'functions' =>
array (size=1)
'c' =>
array (size=2)
'branches' =>
array (size=4)
0 =>
array (size=7)
'op_start' => int 0
'op_end' => int 4
'line_start' => int 4
'line_end' => int 5
'hit' => int 1
'out' =>
array (size=1)
0 => int 9
'out_hit' =>
array (size=1)
0 => int 1
5 =>
array (size=7)
'op_start' => int 5
'op_end' => int 8
'line_start' => int 6
'line_end' => int 5
'hit' => int 1
'out' =>
array (size=1)
0 => int 9
'out_hit' =>
array (size=1)
0 => int 1
9 =>
  array (size=7)
    'op_start' => int 9
    'op_end' => int 11
    'line_start' => int 5
    'line_end' => int 5
    'hit' => int 1
    'out' =>
      array (size=2)
        0 => int 12
        1 => int 5
    'out_hit' =>
      array (size=2)
        0 => int 1
        1 => int 1
12 =>
array (size=7)
'op_start' => int 12
'op_end' => int 13
'line_start' => int 8
'line_end' => int 8
'hit' => int 1
'out' =>
array (size=1)
0 => int 2147483645
'out_hit' =>
array (size=1)
0 => int 0
'paths' =>
array (size=2)
0 =>
array (size=2)
'path' =>
array (size=3)
0 => int 0
1 => int 9
2 => int 12
'hit' => int 0
1 =>
  array (size=2)
    'path' =>
      array (size=5)
        0 => int 0
        1 => int 9
        2 => int 5
        3 => int 9
        4 => int 12
    'hit' => int 1
Inside each function the Returns:9 =>
array (size=7)
'op_start' => int 9
'op_end' => int 11
'line_start' => int 5
'line_end' => int 5
'hit' => int 1
'out' =>
array (size=2)
0 => int 12
1 => int 5
'out_hit' =>
array (size=2)
0 => int 1
1 => int 1The index is the starting opcode, and the fields mean:
Each function also contains a Returns:1 =>
array (size=2)
'path' =>
array (size=5)
0 => int 0
1 => int 9
2 => int 5
3 => int 9
4 => int 12
'hit' => int 1The index is a normal PHP array index, and the fields mean:
The Xdebug source contains a
file
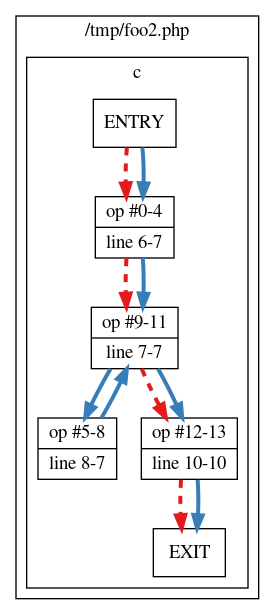
containing a Returns:c - branches - 00; OP: 00-04; line: 06-07 HIT; out1: 09 HIT - 05; OP: 05-08; line: 08-07 HIT; out1: 09 HIT - 09; OP: 09-11; line: 07-07 HIT; out1: 12 HIT; out2: 05 HIT - 12; OP: 12-13; line: 10-10 HIT; out1: EX X - paths - 0 9 12: X - 0 9 5 9 12: HIT
The function also generates a file Example:This generates an image where a solid line means that the path has been followed, and a dashed line means that that path has not been followed.
xdebug_info( ?string $category = null ) : mixed #Show and retrieve diagnostic information This function presents APIs to retrieve information about Xdebug itself. Which information gets returned, or displayed, depends on which arguments, or none at all, are given.
| |||||||||||||||||||||
| You are visitor 01402503 — GeezerVison does not store the pages you look up. Best viewed with Netscape Navigator 4.7 or Internet Explorer 6 at 800×600. No cookies required. |