GeezerVisonThe World Wide Web, restored to 800 pixels of glory. | |||||||||||||||||||||||||||||||||||||||||||||||||||||||||||||||||||||||||||||||||||||||||||||||||||||||||||||||||||||||||||||||||||||||||||||||||||||||||||||||||||
| Home|About|Gaming cabinet|Archives|How it works|Starter sites | |||||||||||||||||||||||||||||||||||||||||||||||||||||||||||||||||||||||||||||||||||||||||||||||||||||||||||||||||||||||||||||||||||||||||||||||||||||||||||||||||||
GeezerVison is showing xdebug.org — Xdebug: Documentation » Function Trace Function TraceXdebug allows you to log all function calls, including parameters and return values to a file in different formats. Those so-called "function traces" can be a help for when you are new to an application or when you are trying to figure out what exactly is going on when your application is running. The function traces can optionally also show the values of variables passed to the functions and methods, and also return values. In the default traces those two elements are not available. Output Formats #There are three output formats. One is meant as a human readable trace, another one is more suited for computer programs as it is easier to parse, and the last one uses HTML for formatting the trace. You can switch between the different formats with the xdebug.trace_format setting. There are a few settings that control which information is written to the trace files. There are settings for including variable assignments (xdebug.collect_assignments) and for including return values (xdebug.collect_return) for example. The example below shows what effect the different settings have for the human readable function traces. The Script
<?php
The ResultsA typical output without the xdebug.collect_return or xdebug.collect_assignments features turned on is the following trace: TRACE START [2007-05-06 14:37:16]
0.0003 114112 -> {main}() ../trace.php:0
0.0004 114272 -> str_split('Xdebug') ../trace.php:8
0.0007 117424 -> ret_ord($c = 'X') ../trace.php:10
0.0007 117584 -> ord('X') ../trace.php:5
0.0009 117584 -> ret_ord($c = 'd') ../trace.php:10
0.0009 117584 -> ord('d') ../trace.php:5
0.0010 117584 -> ret_ord($c = 'e') ../trace.php:10
0.0011 117584 -> ord('e') ../trace.php:5
0.0012 117584 -> ret_ord($c = 'b') ../trace.php:10
0.0013 117584 -> ord('b') ../trace.php:5
0.0014 117584 -> ret_ord($c = 'u') ../trace.php:10
0.0014 117584 -> ord('u') ../trace.php:5
0.0016 117584 -> ret_ord($c = 'g') ../trace.php:10
0.0016 117584 -> ord('g') ../trace.php:5
0.0019 41152
TRACE END [2007-05-06 14:37:16]
There are a number of settings that affect the output of trace files. To show the return values of all function and method calls, turn on the xdebug.collect_return and xdebug.collect_assignments settings. TRACE START [2007-05-06 14:37:35]
0.0003 114112 -> {main}() ../trace.php:0
0.0004 114272 -> str_split('Xdebug') ../trace.php:8
>=> array (0 => 'X', 1 => 'd', 2 => 'e', 3 => 'b', 4 => 'u', 5 => 'g')
0.0007 117424 -> ret_ord($c = 'X') ../trace.php:10
0.0007 117584 -> ord('X') ../trace.php:5
>=> 88
>=> 88
0.0009 117584 -> ret_ord($c = 'd') ../trace.php:10
0.0009 117584 -> ord('d') ../trace.php:5
>=> 100
>=> 100
0.0011 117584 -> ret_ord($c = 'e') ../trace.php:10
0.0011 117584 -> ord('e') ../trace.php:5
>=> 101
>=> 101
0.0013 117584 -> ret_ord($c = 'b') ../trace.php:10
0.0013 117584 -> ord('b') ../trace.php:5
>=> 98
>=> 98
0.0015 117584 -> ret_ord($c = 'u') ../trace.php:10
0.0016 117584 -> ord('u') ../trace.php:5
>=> 117
>=> 117
0.0017 117584 -> ret_ord($c = 'g') ../trace.php:10
0.0018 117584 -> ord('g') ../trace.php:5
>=> 103
>=> 103
>=> 1
0.0021 41152
TRACE END [2007-05-06 14:37:35]
The default format is meant for consumption by humans. It is also possible to
generate a tab separated trace by setting xdebug.trace_format to The Xdebug source distribution has a script that can be used to run some minimal analyses on these files. Version: 3.0.3
TRACE START [2007-05-06 18:29:01]
1 0 0 0.010870 114112 {main} 1 ../trace.php 0
2 1 0 0.032009 114272 str_split 0 ../trace.php 8
2 1 1 0.032073 116632
2 2 0 0.033505 117424 ret_ord 1 ../trace.php 10
3 3 0 0.033531 117584 ord 0 ../trace.php 5
3 3 1 0.033551 117584
2 2 1 0.033567 117584
2 4 0 0.033718 117584 ret_ord 1 ../trace.php 10
3 5 0 0.033740 117584 ord 0 ../trace.php 5
3 5 1 0.033758 117584
2 4 1 0.033770 117584
2 6 0 0.033914 117584 ret_ord 1 ../trace.php 10
3 7 0 0.033936 117584 ord 0 ../trace.php 5
3 7 1 0.033953 117584
2 6 1 0.033965 117584
2 8 0 0.034108 117584 ret_ord 1 ../trace.php 10
3 9 0 0.034130 117584 ord 0 ../trace.php 5
3 9 1 0.034147 117584
2 8 1 0.034160 117584
2 10 0 0.034302 117584 ret_ord 1 ../trace.php 10
3 11 0 0.034325 117584 ord 0 ../trace.php 5
3 11 1 0.034342 117584
2 10 1 0.034354 117584
2 12 0 0.034497 117584 ret_ord 1 ../trace.php 10
3 13 0 0.034519 117584 ord 0 ../trace.php 5
3 13 1 0.034536 117584
2 12 1 0.034549 117584
1 0 1 0.034636 117584
TRACE END [2007-05-06 18:29:01]
VIM syntax file #Xdebug ships with a VIM syntax file that syntax highlights the trace files: xt.vim. In order to make VIM recognise this new format you need to perform the following steps:
With those settings made an opened trace file looks like: TRACE START [2007-05-15 20:06:02]
0.0003 115208 -> {main}() ../trace.php:0
0.0004 115368 -> str_split() ../trace.php:8
0.0006 118520 -> ret_ord() ../trace.php:10
0.0007 118680 -> ord() ../trace.php:5
0.0008 118680 -> ret_ord() ../trace.php:10
0.0009 118680 -> ord() ../trace.php:5
0.0010 118680 -> ret_ord() ../trace.php:10
0.0010 118680 -> ord() ../trace.php:5
0.0012 118680 -> ret_ord() ../trace.php:10
0.0012 118680 -> ord() ../trace.php:5
0.0014 118680 -> ret_ord() ../trace.php:10
0.0014 118680 -> ord() ../trace.php:5
0.0016 118680 -> ret_ord() ../trace.php:10
0.0016 118680 -> ord() ../trace.php:5
0.0019 54880
TRACE END [2007-05-15 20:06:02]
Folding also sorta works so you can use zc and zo to fold away parts of the trace files. Related Content #
Related Settings and Functions #
Settings #boolean xdebug.collect_assignments = false #This setting, defaulting to 0, controls whether Xdebug should add
variable assignments to function traces. Assign-by-var ( boolean xdebug.collect_params = true #Introduced in Xdebug >= 3.3 If enabled (default), files created with the Function Trace feature will include all arguments to functions and methods. When disabled, the argument to each function and method will not be present in the trace files. boolean xdebug.collect_return = false #This setting, defaulting to 0, controls whether Xdebug should write the return value of function calls to the trace files. string xdebug.log = #Configures Xdebug's log file. Xdebug will log to this file all file creations issues, Step Debugging connection attempts, failures, and debug communication. Enable this functionality by setting the value to a absolute path. Make sure
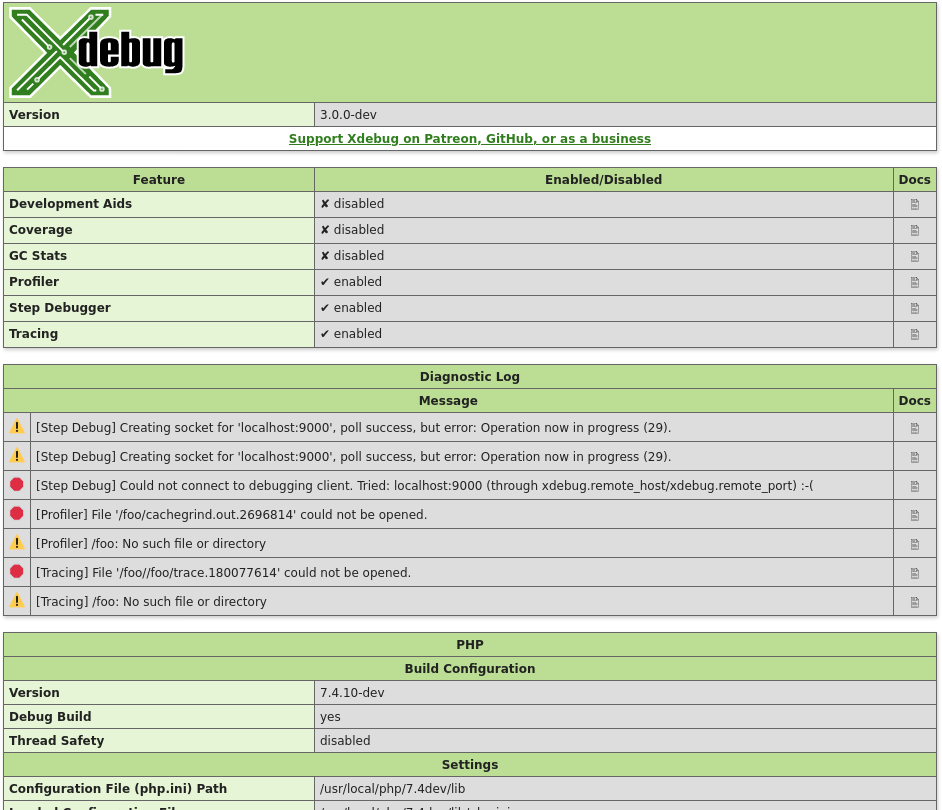
that the system user that PHP runs at (such as The file is opened in append-mode, and will therefore not be overwritten by default. There is no concurrency protection available. The log file will include any attempt that Xdebug makes to connect to an IDE: [2693358] Log opened at 2020-09-02 07:19:09.616195 [2693358] [Step Debug] INFO: Connecting to configured address/port: localhost:9003. [2693358] [Step Debug] ERR: Could not connect to debugging client. Tried: localhost:9003 (through xdebug.client_host/xdebug.client_port). [2693358] [Profiler] ERR: File '/foo/cachegrind.out.2693358' could not be opened. [2693358] [Profiler] WARN: /foo: No such file or directory [2693358] [Tracing] ERR: File '/foo/trace.1485761369' could not be opened. [2693358] [Tracing] WARN: /foo: No such file or directory [2693358] Log closed at 2020-09-02 07:19:09.617510 It includes the opening time ( It includes:
For Step Debugging: INFO: Connecting to configured address/port: localhost:9003. ERR: Could not connect to debugging client. Tried: localhost:9003 (through xdebug.client_host/xdebug.client_port). For Profiling: ERR: File '/foo/cachegrind.out.2693358' could not be opened. WARN: /foo: No such file or directory For Function Trace and Flame Graphs: ERR: File '/foo/trace.1485761369' could not be opened. WARN: /foo: No such file or directory All warnings and errors are described on the Description of errors page, with
detailed instructions on how to resolve the problem, if possible. All errors are always logged through
PHP's internal logging mechanism (configured with error_log
in Step Debugger CommunicationThe debugging log can also log the communication between Xdebug and an IDE.
This communication is in XML, and starts with the <init
xmlns="urn:debugger_protocol_v1" xmlns:xdebug="https://xdebug.org/dbgp/xdebug"
fileuri="file:///home/httpd/www.xdebug.org/html/router.php"
language="PHP" xdebug:language_version="7.4.11-dev"
protocol_version="1.0" appid="2693358" idekey="XDEBUG_ECLIPSE">
<engine version="3.0.0-dev"><![CDATA[Xdebug]]></engine>
<author><![CDATA[Derick Rethans]]></author>
<url><![CDATA[https://xdebug.org]]></url>
<copyright><![CDATA[Copyright (c) 2002-2020 by Derick Rethans]]></copyright>
</init>
The Beyond the <- feature_set -i 4 -n extended_properties -v 1
-> <response
xmlns="urn:debugger_protocol_v1" xmlns:xdebug="https://xdebug.org/dbgp/xdebug"
command="feature_set" transaction_id="4" feature="extended_properties" success="1">
</response>
<- step_into -i 9
-> <response
       xmlns="urn:debugger_protocol_v1" xmlns:xdebug="https://xdebug.org/dbgp/xdebug"
       command="step_into" transaction_id="9"
       status="break" reason="ok">
           <xdebug:message filename="file:///home/httpd/www.xdebug.org/html/router.php" lineno="3">
           </xdebug:message>
   </response>
You can read about DBGP - A common debugger protocol specification at its dedicated documation page. The xdebug.log_level setting controls how much information is logged. Many Linux distributions now use systemd, which
implements private tmp directories. This means that when PHP
is run through a web server or as PHP-FPM, the This setting can additionally be configured through the
integer xdebug.log_level = 7 #Configures which logging messages should be added to the log file. The log file is configured with the xdebug.log setting. The following levels are supported:
Criticals, errors, and warnings always show up in the diagnostics log that you can view by calling xdebug_info(). Criticals and errors are additionally logged through
PHP's internal logging mechanism (configured with error_log
in This setting can additionally be configured through the
string xdebug.mode = develop #This setting controls which Xdebug features are enabled. This setting can only be set in The following values are accepted:
You can enable multiple modes at the same time by comma separating their
identifiers as value to xdebug.mode: XDEBUG_MODE environment variableYou can also set Xdebug's mode by setting the Some web servers have a configuration option to
prevent environment variables from being propagated to PHP and Xdebug.
string xdebug.output_dir = /tmp #The directory where Xdebug will write tracing, profiling, and garbage collection statistics to. This directory needs to be writable for the system user with which PHP is running. This setting can be changed in In some cases (when profiling, or when
xdebug.start_with_request= This setting can additionally be configured through the
Many Linux distributions now use systemd, which
implements private tmp directories. This means that when PHP
is run through a web server or as PHP-FPM, the string xdebug.start_with_request = default #Step Debugging, a Function Trace, Flame Graphs, Garbage Collection Statistics, or Profiling can be activated at the start of a PHP request. Whether this happens depends on the value of this setting:
integer xdebug.trace_format = 0 #The format of the trace file.
Fields for the computerized format, depend on the record type. Entry Line
Exit Line
Return Line
See the introduction for Function Trace for a few examples. integer xdebug.trace_options = 0 #This settings accepts a bitfield to enable options:
To combine multiple flags, you can use bitwise-OR (
string xdebug.trace_output_name = trace.%c #This setting determines the name of the file that is used to dump traces into. The setting specifies the format with format specifiers, very similar to sprintf() and strftime(). There are several format specifiers that can be used to format the file name. The '.xt' extension is always added automatically. The possible format specifiers are:
2 This one is only available for trace file names since Xdebug 2.6. 3 New in version 2.2. This one is set by Apache's mod_unique_id module string xdebug.trigger_value = "" #This setting can be used when xdebug.start_with_request is set to
In The legacy names Normally, Xdebug does not look at which value is actually used. If this setting is set to a non-empty string, then Xdebug will only trigger if the value matches the value of this setting. With the following settings: xdebug.mode=profile xdebug.start_with_request=trigger xdebug.trigger_value=StartProfileForMe Xdebug's profiler will only start when either the environment variable
From Xdebug 3.1, it is possible to configure multiple values by using a comma separated list. In that case, Xdebug will trigger if the supplied value matches any of the entries that are configured through this setting: xdebug.trigger_value=StartDebuggerForMe,StartDebuggerForYou See also:
boolean xdebug.use_compression = true #Introduced in Xdebug >= 3.1 If enabled, the Function Trace and Profiling features will create GZip compressed files as output. This reduces diskspace. If GZip compression is not supported by Xdebug, because it was not compiled in, then Xdebug will add a warning to its log and xdebug_info() diagnostics section. It is enabled by default if Xdebug has GZip support, and disable if Xdebug does not have GZip support. The QCacheGrind tool that you can use to visualise profiling information
does not support reading GZip compressed profile files, whereas KCacheGrind and
PhpStorm do. If you are a QCacheGrind user, you should set
xdebug.use_compression to integer xdebug.var_display_max_children = 128 #Controls the amount of array children and object's properties are shown when variables are displayed with either xdebug_var_dump(), xdebug.show_local_vars or when making a Function Trace. To disable any limitation, use -1 as value. This setting does not have any influence on the number of children that is send to the client through the Step Debugging feature. integer xdebug.var_display_max_data = 512 #Controls the maximum string length that is shown when variables are displayed with either xdebug_var_dump(), xdebug.show_local_vars or when making a Function Trace. To disable any limitation, use -1 as value. This setting does not have any influence on the number of children that is send to the client through the Step Debugging feature. integer xdebug.var_display_max_depth = 3 #Controls how many nested levels of array elements and object properties are when variables are displayed with either xdebug_var_dump(), xdebug.show_local_vars or when making a Function Trace. The maximum value you can select is 1023. You can also use -1 as value to select this maximum number. This setting does not have any influence on the number of children that is send to the client through the Step Debugging feature. Setting the value to a high number could potentially result in PHP using up all the available memory, so use with caution. Functions #xdebug_get_function_stack( array $options = [] ) : array #Returns information about the stack Returns an array which resembles the stack trace up to this point. The example script: Example:Returns:array (size=3)
0 =>
array (size=6)
'time' => float 2.648155248
'memory' => int 530520
'function' => string '{main}' (length=6)
'file' => string 'Standard input code' (length=19)
'line' => int 0
'params' =>
array (size=0)
empty
1 =>
array (size=8)
'time' => float 2.648221973
'memory' => int 530664
'function' => string 'fix_strings' (length=11)
'type' => string 'dynamic' (length=7)
'class' => string 'strings' (length=7)
'file' => string 'Standard input code' (length=19)
'line' => int 16
'params' =>
array (size=1)
'b' => string '[0 => 'Derick']' (length=15)
2 =>
array (size=8)
'time' => float 2.648243513
'memory' => int 530664
'function' => string 'fix_string' (length=10)
'type' => string 'dynamic' (length=7)
'class' => string 'strings' (length=7)
'file' => string 'Standard input code' (length=19)
'line' => int 10
'params' =>
array (size=1)
'a' => string ''Derick'' (length=8)
Through the $options['local_vars'] #
If you set the Example:Returns:array (size=3)
0 =>
array (size=7)
'time' => float 4.507993828
'memory' => int 586272
'function' => string '{main}' (length=6)
'file' => string 'Standard input code' (length=19)
'line' => int 0
'params' =>
array (size=0)
empty
'variables' =>
array (size=2)
's' =>
object(strings)[1]
'ret' => null
1 =>
array (size=9)
'time' => float 4.508039954
'memory' => int 586416
'function' => string 'fix_strings' (length=11)
'type' => string 'dynamic' (length=7)
'class' => string 'strings' (length=7)
'file' => string 'Standard input code' (length=19)
'line' => int 16
'params' =>
array (size=1)
'b' => string '[0 => 'Derick']' (length=15)
'variables' =>
array (size=2)
'b' =>
array (size=1)
...
'item' => string 'Derick' (length=6)
2 =>
array (size=9)
'time' => float 4.508065061
'memory' => int 586416
'function' => string 'fix_string' (length=10)
'type' => string 'dynamic' (length=7)
'class' => string 'strings' (length=7)
'file' => string 'Standard input code' (length=19)
'line' => int 10
'params' =>
array (size=1)
'a' => string ''Derick'' (length=8)
'variables' =>
array (size=1)
'a' => string 'Derick' (length=6)
The values in the $options['params_as_values'] #
You can changes these to also be values by setting the Example:Returns:array (size=3)
0 =>
array (size=6)
'time' => float 5.128140207
'memory' => int 589968
'function' => string '{main}' (length=6)
'file' => string 'Standard input code' (length=19)
'line' => int 0
'params' =>
array (size=0)
empty
1 =>
array (size=8)
'time' => float 5.128188808
'memory' => int 590112
'function' => string 'fix_strings' (length=11)
'type' => string 'dynamic' (length=7)
'class' => string 'strings' (length=7)
'file' => string 'Standard input code' (length=19)
'line' => int 16
'params' =>
array (size=1)
'b' =>
array (size=1)
...
2 =>
array (size=8)
'time' => float 5.128214727
'memory' => int 590112
'function' => string 'fix_string' (length=10)
'type' => string 'dynamic' (length=7)
'class' => string 'strings' (length=7)
'file' => string 'Standard input code' (length=19)
'line' => int 10
'params' =>
array (size=1)
'a' => string 'Derick' (length=6)$options['from_exception'] #
The last option is This should be used in a user-defined exception handler. Example:Returns:array (size=3)
0 =>
array (size=7)
'time' => float 5.194523655
'memory' => int 595976
'function' => string '{main}' (length=6)
'file' => string 'Standard input code' (length=19)
'line' => int 0
'params' =>
array (size=0)
empty
'variables' =>
array (size=1)
'e' => null
1 =>
array (size=9)
'time' => float 5.194572727
'memory' => int 596440
'function' => string '__construct' (length=11)
'type' => string 'dynamic' (length=7)
'class' => string 'Error_Entry' (length=11)
'file' => string 'Standard input code' (length=19)
'line' => int 38
'params' =>
array (size=2)
'base' => int 1
'errno' => int 2
'variables' =>
array (size=3)
'base' => int 1
'errno' => int 2
'return' => null
2 =>
array (size=9)
'time' => float 5.194576134
'memory' => int 596440
'function' => string 'newError' (length=8)
'type' => string 'static' (length=6)
'class' => string 'Error_Class' (length=11)
'file' => string 'Standard input code' (length=19)
'line' => int 33
'params' =>
array (size=1)
'errno' => boolean true
'variables' =>
array (size=3)
'errno' => boolean true
'elephpant' =>
object(Elephpant)[2]
...
'randoVar' => int 42
The stack trace you get when using xdebug_get_monitored_functions() : array #Returns information about monitored functions Returns a structure which contains information about where the monitored functions were executed in your script. The following example shows how to use this, and the returned information: Example:Returns:/tmp/monitor-example.php:10:
array(2) {
[0] =>
array(3) {
'function' =>
string(6) "strrev"
'filename' =>
string(24) "/tmp/monitor-example.php"
'lineno' =>
int(6)
}
[1] =>
array(3) {
'function' =>
string(6) "strrev"
'filename' =>
string(24) "/tmp/monitor-example.php"
'lineno' =>
int(8)
}
}xdebug_get_stack_depth() : int #Returns the current stack depth level Returns the stack depth level. The main body of a script is level 0 and each include and/or function call adds one to the stack depth level. xdebug_get_tracefile_name() : false|string #Returns the name of the function trace file
Returns the name of the file which is used to trace the output of this
script to, or xdebug_info( ?string $category = null ) : mixed #Show and retrieve diagnostic information This function presents APIs to retrieve information about Xdebug itself. Which information gets returned, or displayed, depends on which arguments, or none at all, are given.
| |||||||||||||||||||||||||||||||||||||||||||||||||||||||||||||||||||||||||||||||||||||||||||||||||||||||||||||||||||||||||||||||||||||||||||||||||||||||||||||||||||

| ( ! ) Xdebug: Your own message in /home/httpd/html/test/xdebug/print_function_stack.php on line 5 | ||||
|---|---|---|---|---|
| Call Stack | ||||
| # | Time | Memory | Function | Location |
| 1 | 0.0006 | 653896 | {main}( ) | ../print_function_stack.php:0 |
| 2 | 0.0007 | 654616 | foo( 42, 3141592654 ) | ../print_function_stack.php:7 |
| 3 | 0.0007 | 654736 | xdebug_print_function_stack ( 'Your own message' ) | ../print_function_stack.php:5 |
The bitmask "options" allows you to configure a few extra options. The following options are currently supported:
XDEBUG_STACK_NO_DESC- If this option is set, then the printed stack trace will not have a
header. This is useful if you want to print a stack trace from your own error
handler, as otherwise the printed location is where
xdebug_print_function_stack()was called from.
xdebug_start_function_monitor( array $listOfFunctionsToMonitor ) : void #
Starts function monitoring
This function starts the monitoring of functions that were given in a list as argument to this function. Function monitoring allows you to find out where in your code the functions that you provided as argument are called from. This can be used to track where old, or, discouraged functions are used.
Example:
<?php
xdebug_start_function_monitor( [ 'strrev', 'array_push' ] );
?>
You can also add class methods and static methods to the array that defines which functions to monitor. For example, to catch static calls to DramModel::canSee and dynamic calls to Whisky->drink, you would start the monitor with:
Example:
<?php
xdebug_start_function_monitor( [ 'DramModel::canSee', 'Whisky->drink'] );
?>
The defined functions are case sensitive, and a dynamic call to a static method will not be caught.
xdebug_start_trace( ?string $traceFile = null, int $options = 0 ) : ?string #
Starts a new function trace
Start tracing function calls from this point to the file in the
$trace_file parameter. If no filename is given, then the trace file will
be placed in the directory as configured by the xdebug.output_dir setting.
In case a file name is given as first parameter, the name is relative to the current working directory. This current working directory might be different than you expect it to be, so please use an absolute path in case you specify a file name. Use the PHP function getcwd() to figure out what the current working directory is.
The name of the trace file is {$trace_file}.xt. If the trace was started at
the beginning of the request because xdebug.start_with_request is set to
yes, then the filename depends on the
xdebug.trace_output_name setting.
The options parameter is a bitfield; currently there are four options:
- XDEBUG_TRACE_APPEND (0x01)
- Trace file data will be appended to an already existing file with the same name, instead of it being overwritten.
- XDEBUG_TRACE_COMPUTERIZED (0x02)
- Switches the file format to the tab separated format. The format is described in the xdebug.trace_format setting as "format 1".
- XDEBUG_TRACE_HTML (0x04)
- Switches to a file format that shows data as an HTML table.
- XDEBUG_TRACE_NAKED_FILENAME (0x08)
- With the XDEBUG_TRACE_NAKED_FILENAME flag set,
.xtis not added automatically to the end of trace file names. - XDEBUG_TRACE_FLAMEGRAPH_COST (0x10)
- Switches to a file format that contains data to create a flame graph visualing CPU time.
- XDEBUG_TRACE_FLAMEGRAPH_MEM (0x20)
- Switches to a file format that contains data to create a flame graph visualing memory usage.
The XDEBUG_TRACE_FLAMEGRAPH_COST and
XDEBUG_TRACE_FLAMEGRAPH_MEM flags are used to create flame graph
data. Flame Graphs are described separately.
Example:
<?php
xdebug_start_trace("/tmp/xdebug.trace", XDEBUG_TRACE_COMPUTERIZED|XDEBUG_TRACE_NAKED_FILENAME);
?>
The line above creates a file named /tmp/xdebug.trace.
It does not add .xt to the end of the filename (due to
XDEBUG_TRACE_NAKED_FILENAME).
The tab-separated trace file format is used due to
XDEBUG_TRACE_COMPUTERIZED.
The settings xdebug.collect_assignments, xdebug.collect_params, and xdebug.collect_return influence what information is logged to the trace file and the setting xdebug.trace_format influences the format of the trace file.
The full path and filename to which Xdebug traces is returned from this
function. This will be either the filename you pass in (potentially with
.xt added), or the auto generated filename if no filename has been
passed in.
xdebug_stop_function_monitor() : void #
Stops monitoring functions
This function stops the function monitor. In order to get the list of monitored functions, you need to use the xdebug_get_monitored_functions() function.
xdebug_stop_trace() : false|string #
Stops the current function trace
Stop tracing function calls and closes the trace file.
The function returns the filename of the file where the trace was written to.
Best viewed with Netscape Navigator 4.7 or Internet Explorer 6 at 800×600. No cookies required.