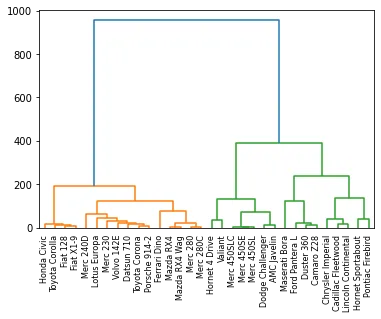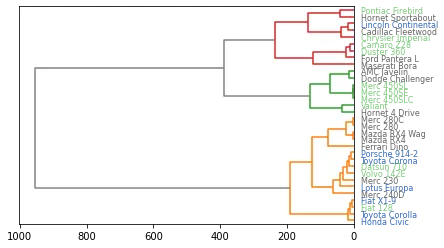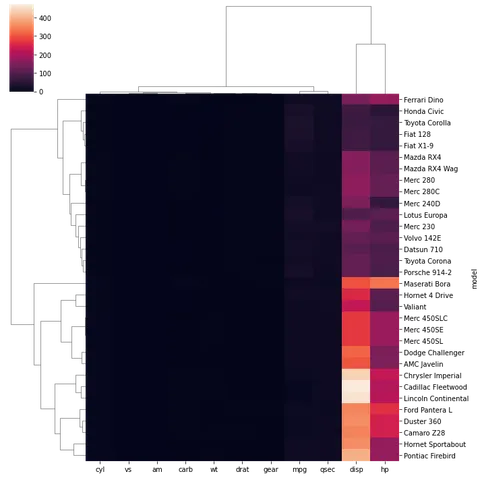
To draw a dendrogram, you first need to have a numeric matrix. Each line represents an entity (here a car). Each column is a variable that describes the cars. The objective is to cluster the entities to show who shares similarities with whom. The dendrogram will draw the similar entities closer to each other in the tree.
Let’s start by loading a dataset and the requested libraries:
# Libraries
import pandas as pd
from matplotlib import pyplot as plt
from scipy.cluster.hierarchy import dendrogram, linkage
import numpy as np

# Import the mtcars dataset from the web + keep only numeric variables
url = 'https://raw.githubusercontent.com/holtzy/The-Python-Graph-Gallery/master/static/data/mtcars.csv'
df = pd.read_csv(url)
df = df.set_index('model')
df = df.reset_index(drop=True)
df.head()| mpg | cyl | disp | hp | drat | wt | qsec | vs | am | gear | carb | |
|---|---|---|---|---|---|---|---|---|---|---|---|
| 0 | 21.0 | 6 | 160.0 | 110 | 3.90 | 2.620 | 16.46 | 0 | 1 | 4 | 4 |
| 1 | 21.0 | 6 | 160.0 | 110 | 3.90 | 2.875 | 17.02 | 0 | 1 | 4 | 4 |
| 2 | 22.8 | 4 | 108.0 | 93 | 3.85 | 2.320 | 18.61 | 1 | 1 | 4 | 1 |
| 3 | 21.4 | 6 | 258.0 | 110 | 3.08 | 3.215 | 19.44 | 1 | 0 | 3 | 1 |
| 4 | 18.7 | 8 | 360.0 | 175 | 3.15 | 3.440 | 17.02 | 0 | 0 | 3 | 2 |
All right, now that we have our numeric matrix, we can calculate the distance between each car, and draw the hierarchical clustering. Distance calculation can be done by the linkage() function. I strongly advise you to visit the next page for more details concerning this crucial step.
# Calculate the distance between each sample
# You have to think about the metric you use (how to measure similarity) + about the method of clusterization you use (How to group cars)
Z = linkage(df, 'ward')
Last but not least, you can easily plot this object as a dendrogram using the dendrogram() function of scipy library. These parameters are passed to the function:
Z: The linkage matrixlabels: Labels to put under the leaf nodeleaf_rotation: Specifies the angle (in degrees) to rotate the leaf labels
See post #401 for possible customisations to a dendrogram.
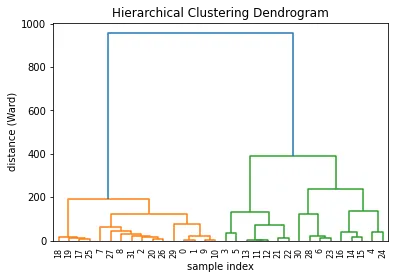
# Plot title
plt.title('Hierarchical Clustering Dendrogram')

# Plot axis labels
plt.xlabel('sample index')
plt.ylabel('distance (Ward)')

# Make the dendrogram
dendrogram(Z, labels=df.index, leaf_rotation=90)

# Show the graph
plt.show()