GV

GeezerVison

The World Wide Web, restored to 800 pixels of glory.

Home|About|Gaming cabinet|Archives|How it works|Starter sites

On this site

  • All
  • Best
  • Libs
  • Learn

This view

  • Original page
  • New address

GeezerVison is showing python-graph-gallery.com — Pie plot | Python & Matplotlib examples

Pie Plot
logo of a chart:Pie

A Pie Chart is a circle divided into sectors that each represent a proportion of the whole. It is one of the most common viz type, but also probably the most criticized. In python, they are most of the time done thanks to the pie() function of the Matplotlib library.

Pie Chart sectionAbout this chart

⏱ Quick start

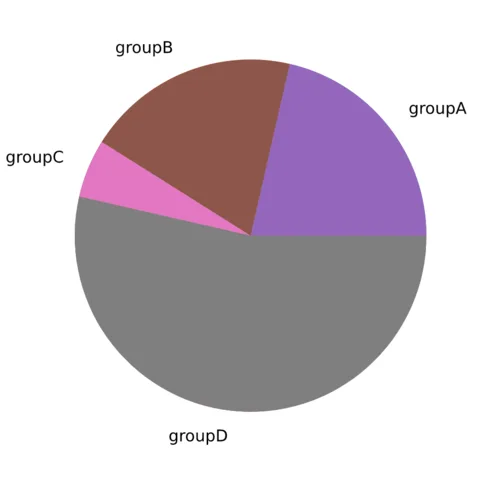
matplotlib allows to build a pie chart easily thanks to its pie() function.

The input data you must provide is an array of numbers, where each numbers will be mapped to one of the pie item.🔥
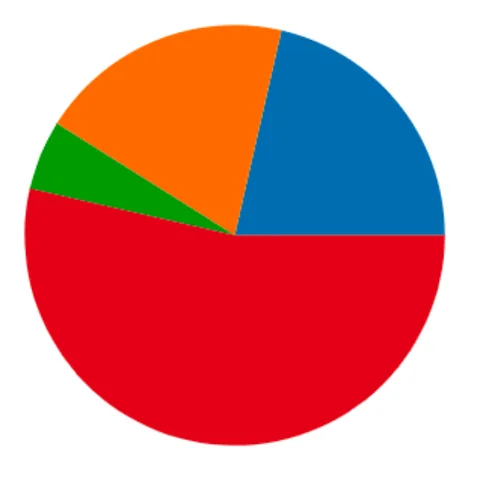
Most basic donut chart with Python and Matplotlib

Most basic donut chart with Python and Matplotlib

# library
import matplotlib.pyplot as plt

# create data: an array of values
size_of_groups=[12,11,3,30]

# Create a pieplot
plt.pie(size_of_groups)
plt.show()

⚠️ Avoid the 61 most common dataviz mistakes

Boxplots hiding information, pie charts, cut axes, spaghetti charts... I gathered the 61 dataviz caveats I see the most as a deck of cards. Each card shows a chart that is not ideal, and a better alternative.

Get the full deck for free:

I respect your privacy. Unsubscribe anytime.

Dataviz caveat card: What's wrong with pie charts?
61
cards

⚠️ Mind the pie chart

Pie chart is probably the most criticized chart type. Humans are pretty bad at reading angles, making it hard to rank the groups accurately. Most of the time, it is better to display the information as a barchart, a treemap or a lollipop plot.

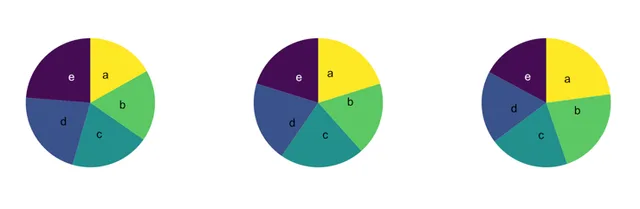
Have a look to the 3 pie charts below, can you spot the pattern hidden in it?

Can you spot the pattern hidden behind those 3 pie charts? Click to see the same info visualized as barplots: much more insightful isn't it?

Can you spot the pattern hidden behind those 3 pie charts? Click to see the same info visualized as barplots: much more insightful isn't it?

See it as a barplot

Last but not least, please avoid the explode and shadow options of the pie() function, they are killing all the most basic dataviz principles.

Matplotlib logoPie chart with Matplotlib

The examples below should guide you through the pie() function usage. It starts basics and then show how to add labels, customize colors and more.

Add and customize the labels

Add and customize the labels

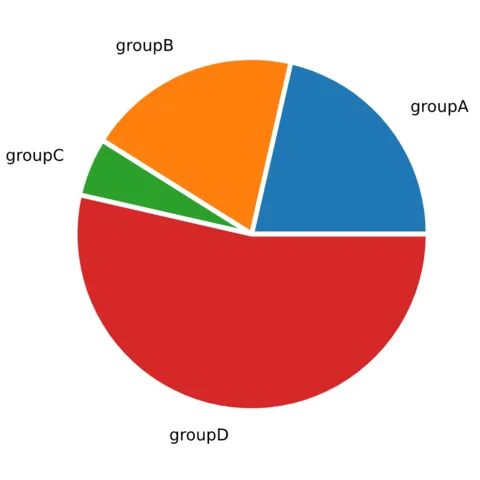
Customize the pie section colors

Customize the pie section colors

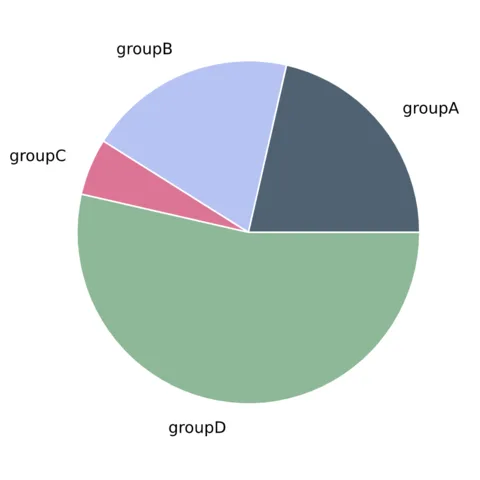
Add blank space between each pie section.

Add blank space between each pie section.

Related chart types

logo of a chart:Tree

Treemap

logo of a chart:Venn

Venn Diagram

logo of a chart:Doughnut

Donut

logo of a chart:Pie

Pie Chart

logo of a chart:Dendrogram

Dendrogram

logo of a chart:CircularPacking

Circular Packing

logo of a chart:Waffle2

Waffle

300 projects

💡 Out of dataviz inspiration?

I have spent years collecting the most beautiful data visualizations out there. Get the list of my top 300 dataviz projects, hand-picked, for free.

I respect your privacy. Unsubscribe anytime.

You are visitor 01402503 — GeezerVison does not store the pages you look up.
Best viewed with Netscape Navigator 4.7 or Internet Explorer 6 at 800×600. No cookies required.