GV

GeezerVison

The World Wide Web, restored to 800 pixels of glory.

Home|About|Gaming cabinet|Archives|How it works|Starter sites

On this site

  • All
  • Best
  • Libs
  • Learn

This view

  • Original page
  • New address

GeezerVison is showing python-graph-gallery.com — Dendrogram

Dendrogram

logo of a chart:Dendrogram

A dendrogram is a network structure. It is constituted of a root node that gives birth to several nodes connected by edges or branches. It is used to represent a hierarchical structure or to display the result of a clustering algorithm.

Dendrogram sectionAbout this chart

ℹ ️ Two types of dendrogram

It is important to understand that dendrograms are used in 2 very different conditions that are based on 2 different data inputs:

  • Hierarchical dataset: think about a CEO managing team leads managing employees and so on.
  • Clustering result: clustering divides a set of individuals in group according to their similarity. Its result can be visualized as a tree, often going together with a heatmap.
Read more about dendrogram

Matplotlib logoDendrogram for clustering with Matplotlib

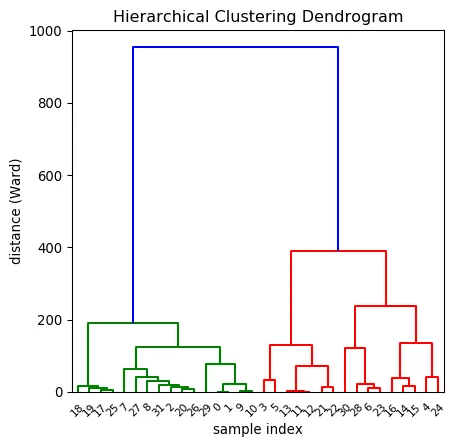
The first chart of this section explains how to build a basic dendrogram with Python and matplotlib. It starts from a numeric matrix, compute the similarity between each pair of item thanks to the linkage() function and plot the result with the dendrogram() function.

Most basic dendrogram and clustering with Python and Matplotlib

Most basic dendrogram and clustering with Python and Matplotlib

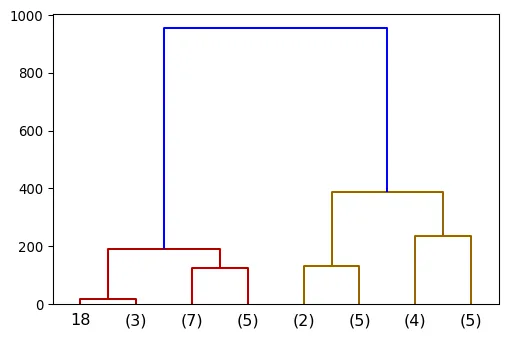
The next post explains how to customize the output: change node and edge features like color and shapes, select a specific part of the tree and more.

Most basic dendrogram and clustering with Python and Matplotlib

Most basic dendrogram and clustering with Python and Matplotlib

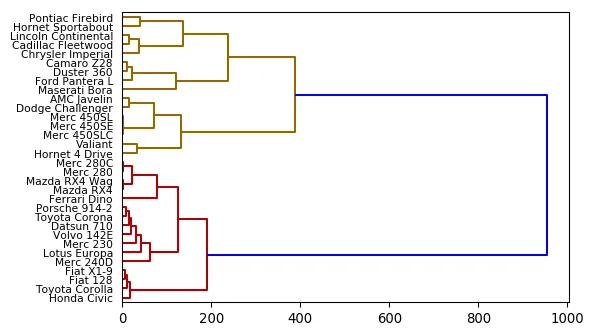
Horizontal dendrogram

Horizontal dendrogram

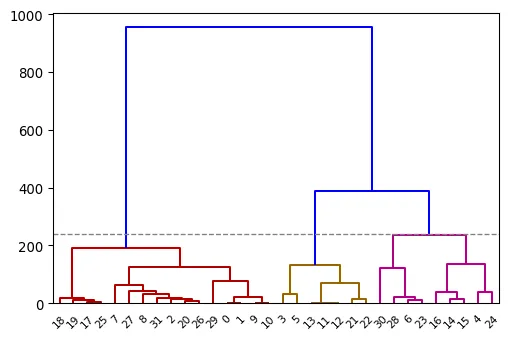
Cut the dendrogram at a specific height

Cut the dendrogram at a specific height

⚠️ Avoid the 61 most common dataviz mistakes

Boxplots hiding information, pie charts, cut axes, spaghetti charts... I gathered the 61 dataviz caveats I see the most as a deck of cards. Each card shows a chart that is not ideal, and a better alternative.

Get the full deck for free:

I respect your privacy. Unsubscribe anytime.

Dataviz caveat card: Boxplots hide information
61
cards

Seaborn logoDendrogram, clustering and heatmaps with Seaborn

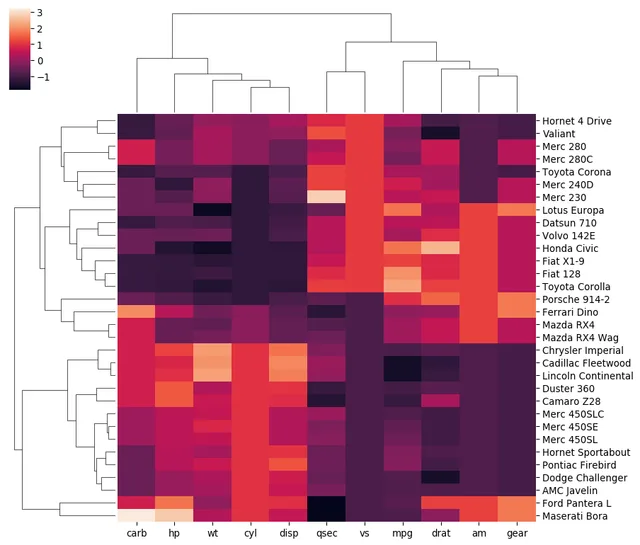
It is very common to display the results of a clustering using a heatmap with dendrograms around it. Fortunately the Seaborn library makes it a breeze.

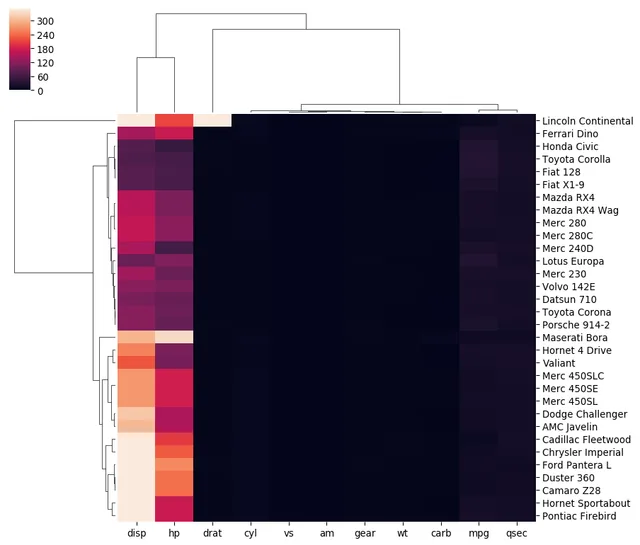
The examples below will guide you through the most usual needs. Note however that data normalization should be your main focus here, as it can massively impact the final visual result. (See this post for that).

Related: heatmap section
A seaborn heatmap with clusterization and dendrogram applied

A seaborn heatmap with clusterization and dendrogram applied

Most basic heatmap with dendrogram with seaborn

Most basic heatmap with dendrogram with seaborn

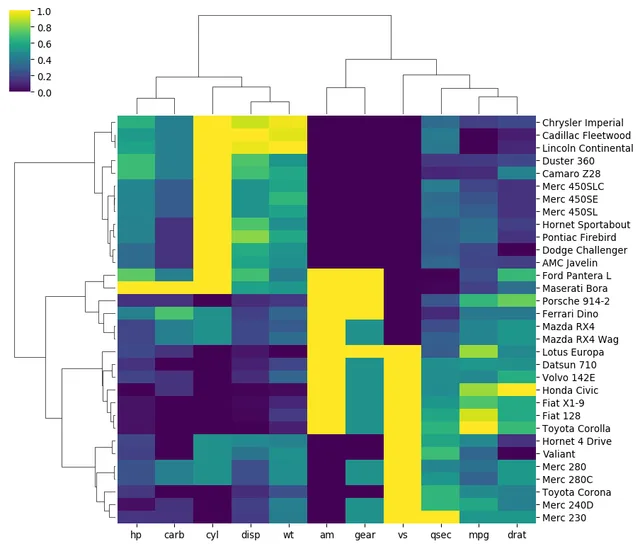
Change color palette

Change color palette

Learn how to normalize data in the heatmap, avoiding that kind of result

Learn how to normalize data in the heatmap, avoiding that kind of result

Dendrogram for hierarchical datasets

Dendrogram can also be used to display a hierarchy. A hierarchy as a root node that gets divided in several children and so on.

TODO

Related chart types

logo of a chart:Tree

Treemap

logo of a chart:Venn

Venn Diagram

logo of a chart:Doughnut

Donut

logo of a chart:Pie

Pie Chart

logo of a chart:Dendrogram

Dendrogram

logo of a chart:CircularPacking

Circular Packing

logo of a chart:Waffle2

Waffle

300 projects

💡 Out of dataviz inspiration?

I have spent years collecting the most beautiful data visualizations out there. Get the list of my top 300 dataviz projects, hand-picked, for free.

I respect your privacy. Unsubscribe anytime.

You are visitor 01402503 — GeezerVison does not store the pages you look up.
Best viewed with Netscape Navigator 4.7 or Internet Explorer 6 at 800×600. No cookies required.