GV

GeezerVison

The World Wide Web, restored to 800 pixels of glory.

Home|About|Gaming cabinet|Archives|How it works|Starter sites

On this site

  • All
  • Best
  • Libs
  • Learn

This view

  • Original page
  • New address

GeezerVison is showing python-graph-gallery.com — Python Area Chart Examples with Code

Area Chart

logo of a chart:Area

An area chart is really similar to a line chart, except that the area between the x axis and the line is filled in with color or shading. It represents the evolution of a numeric variable. This section starts by considering matplotlib and seaborn as tools to build area charts. It then shows a few other options for timeseries.

Area chart sectionAbout this chart

⏱ Quick start

There are 2 main ways to build an area chart with Matplotlib. In both case it requires 2 numeric vectors of values as input.

  • The fill_between() function
  • The stackplot() function that is more useful for stacked area charts
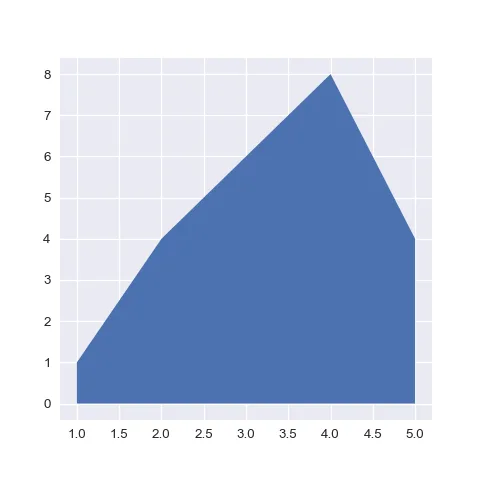
The most basic area chart one can make with python and matplotlib

The most basic area chart one can make with python and matplotlib

# library
import numpy as np
import matplotlib.pyplot as plt

# Create data
x=range(1,6)
y=[1,4,6,8,4]

# Area plot
plt.fill_between(x, y)
plot.show()

Matplotlib logoArea chart with Matplotlib

Matplotlib is a great fit to build an area chart thanks to its fill_between() function. Here are a few examples explaining its basics and how to apply some common customization.

The most basic area chart one can make with python and matplotlib

The most basic area chart one can make with python and matplotlib

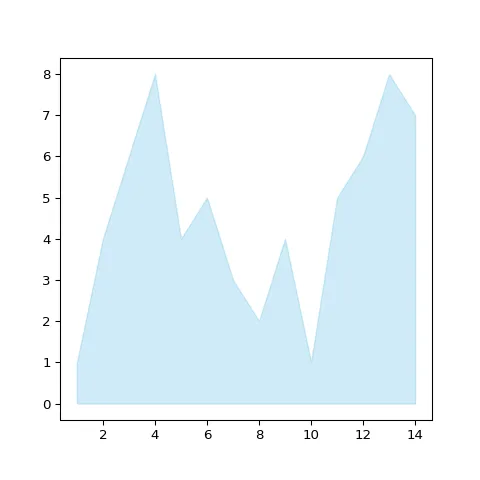
Control chart color (Matplotlib)

Control chart color (Matplotlib)

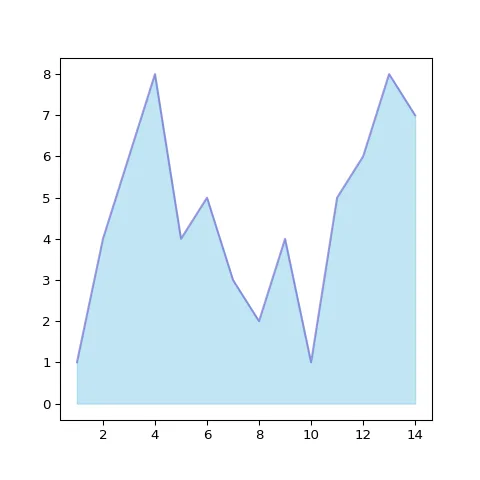
Control line color

Control line color

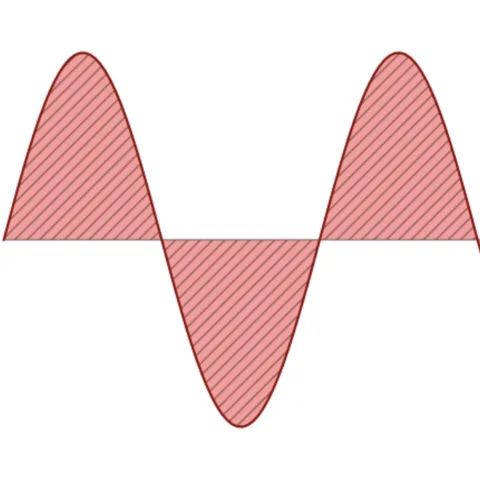
Add patterns to your area chart

Add patterns to your area chart

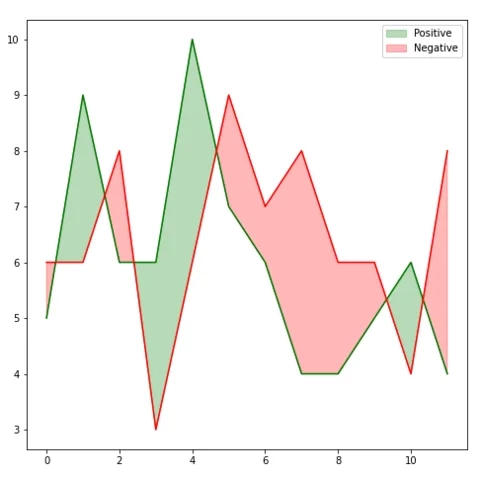
Fill the gap between 2 line charts

Fill the gap between 2 line charts

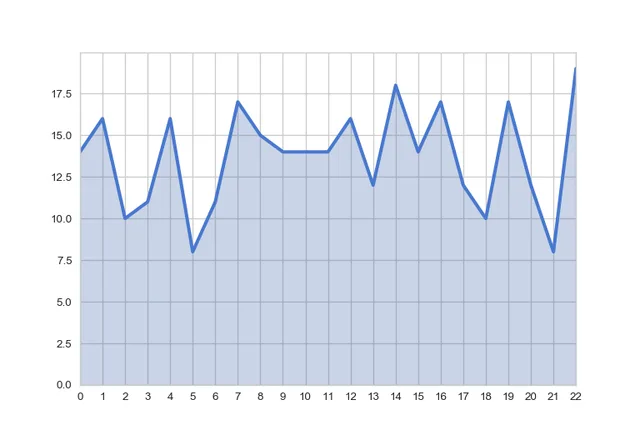
Area chart with custom grid

Area chart with custom grid

⚠️ Avoid the 61 most common dataviz mistakes

Boxplots hiding information, pie charts, cut axes, spaghetti charts... I gathered the 61 dataviz caveats I see the most as a deck of cards. Each card shows a chart that is not ideal, and a better alternative.

Get the full deck for free:

I respect your privacy. Unsubscribe anytime.

Dataviz caveat card: Boxplots hide information
61
cards

Seaborn logoArea chart with Seaborn

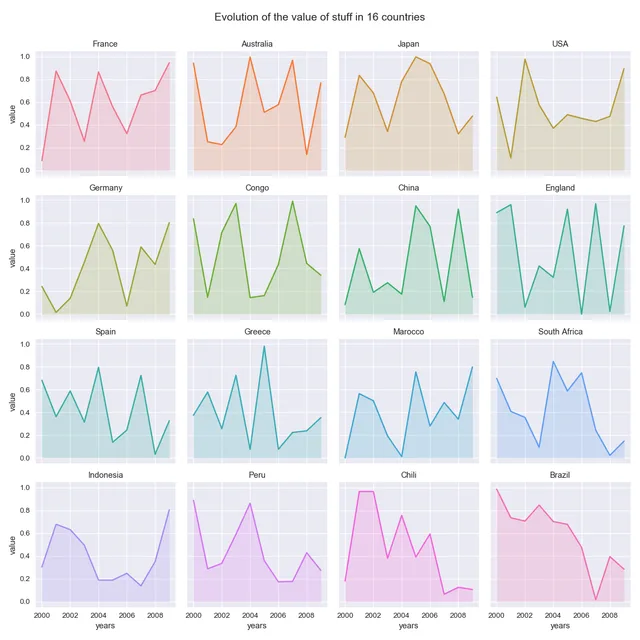
Seaborn is another great alternative to build an area chart with python. The below examples show how to start basic, apply usual customization, and use the small multiple technique for when you have several groups to compare.

Area chart with small multiple, seaborn

Area chart with small multiple, seaborn

Matplotlib logoBest area chart examples

The web is full of astonishing charts made by awesome bloggers, (often using R). The Python graph gallery tries to display (or translate from R) some of the best creations and explain how their source code works. If you want to display your work here, please drop me a word or even better, submit a Pull Request!

Display 2 line charts and fill the area between both. Also uses faceting to split by groups.

Display 2 line charts and fill the area between both. Also uses faceting to split by groups.

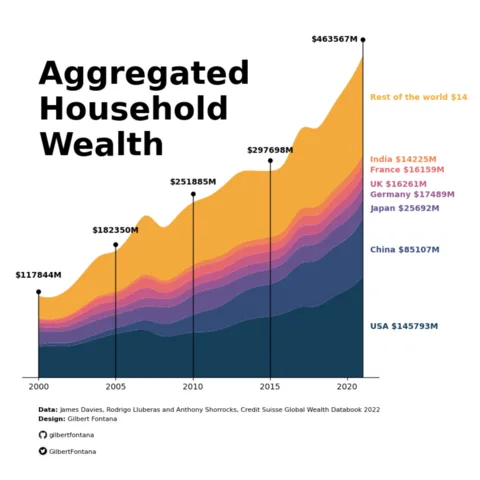
A clean stacked area chart with smoothing, inline labels, caption, color palette and more

A clean stacked area chart with smoothing, inline labels, caption, color palette and more

Plotly line chart with many customization

Plotly line chart with many customization

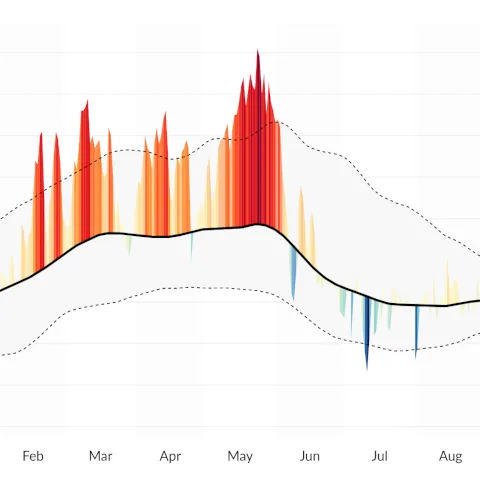
A minimalist area chart with clean annotations and style

A minimalist area chart with clean annotations and style

Related chart types

logo of a chart:Line

Line chart

logo of a chart:Area

Area chart

logo of a chart:StackedArea

Stacked Area

logo of a chart:Stream

Streamgraph

logo of a chart:CandleStick2

Candlestick

logo of a chart:time

Timeseries

300 projects

💡 Out of dataviz inspiration?

I have spent years collecting the most beautiful data visualizations out there. Get the list of my top 300 dataviz projects, hand-picked, for free.

I respect your privacy. Unsubscribe anytime.

You are visitor 01402503 — GeezerVison does not store the pages you look up.
Best viewed with Netscape Navigator 4.7 or Internet Explorer 6 at 800×600. No cookies required.