GV

GeezerVison

The World Wide Web, restored to 800 pixels of glory.

Home|About|Gaming cabinet|Archives|How it works|Starter sites

On this site

  • All
  • Best
  • Libs
  • Learn

This view

  • Original page
  • New address

GeezerVison is showing python-graph-gallery.com — Python Density Chart Gallery | Dozens of examples with code

Density chart

logo of a chart:Density

Density plots allow you to visualize the distribution of a numeric variable for one or several groups. They are very well adapted for large datasets, as stated in data-to-viz.com.

Note that 2 approaches exist to build them in python: the first one consists of computing a kernel density estimate, and the second one involves building a high resolution histogram.

Density sectionAbout this chart

⏱ Quick start

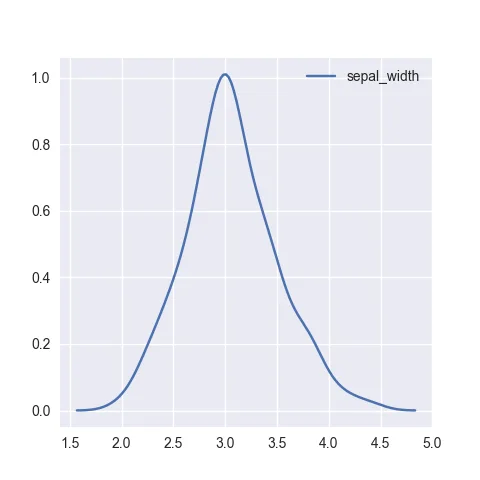
If you are in a rush, the most straightforward way to build a density chart is to use Seaborn and its kdeplot() function. You just need to provide it with a numeric variable from your dataset. 🔥

The most basic density plot one can make with python and seaborn

The most basic density plot one can make with python and seaborn

# library & dataset
import seaborn as sns
df = sns.load_dataset('iris')

# Make default density plot
sns.kdeplot(df['sepal_width'])

Seaborn logoDensity charts with Seaborn

Seaborn is a python library allowing to make better charts easily. It is well adapted to build density charts thanks to its kdeplot function.

The following charts will guide you through its usage, going from a very basic density plot to something much more customized.

The most basic density plot one can make with python and seaborn

The most basic density plot one can make with python and seaborn

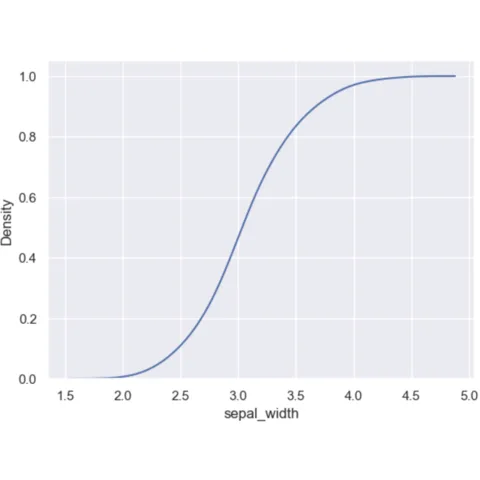
Cumulative version of the most basic density plot

Cumulative version of the most basic density plot

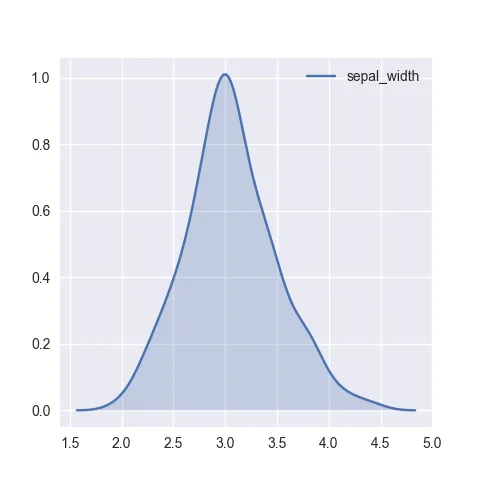
seaborn densty chart with filled area

seaborn densty chart with filled area

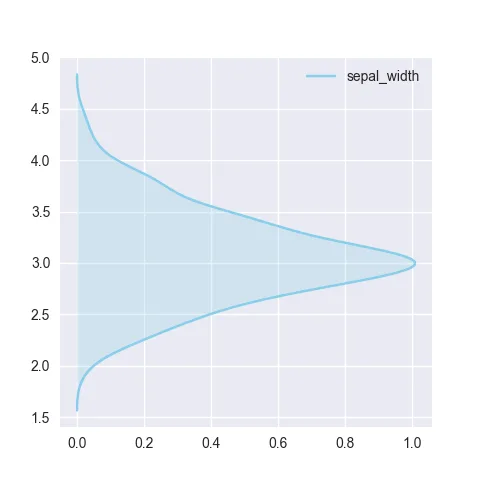
vertical seaborn density chart

vertical seaborn density chart

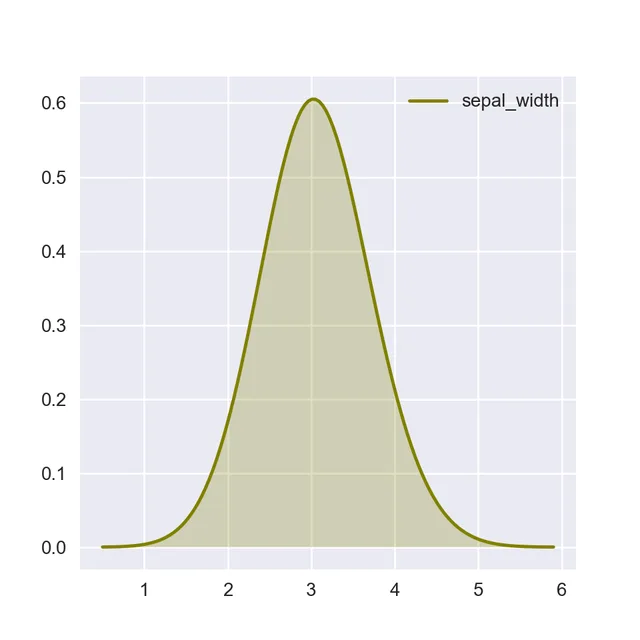
control density chart color

control density chart color

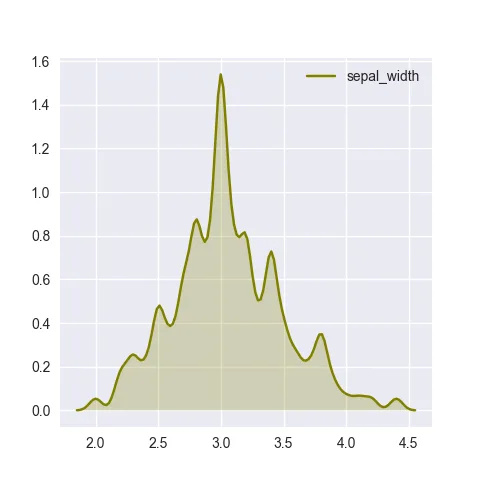
Changed the bandwidth used to compute the density

Changed the bandwidth used to compute the density

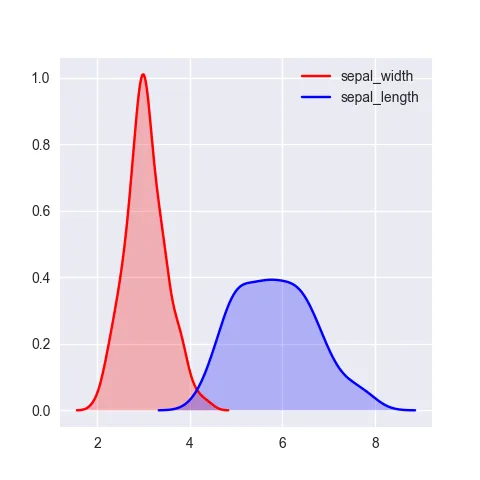
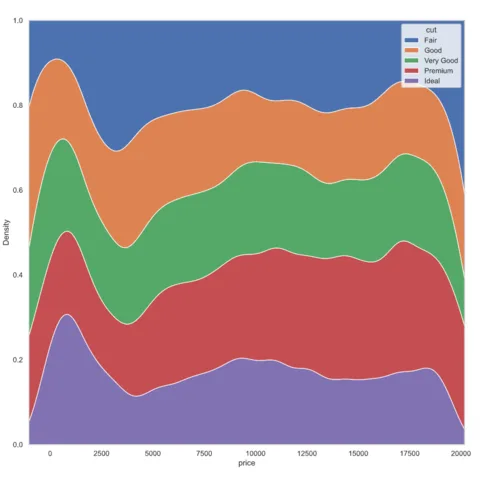
Density chart with several displayed groups

Density chart with several displayed groups

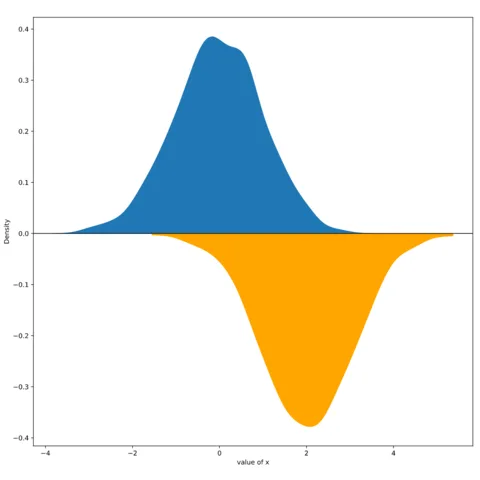
Mirror density chart to compare the distribution of 2 variables

Mirror density chart to compare the distribution of 2 variables

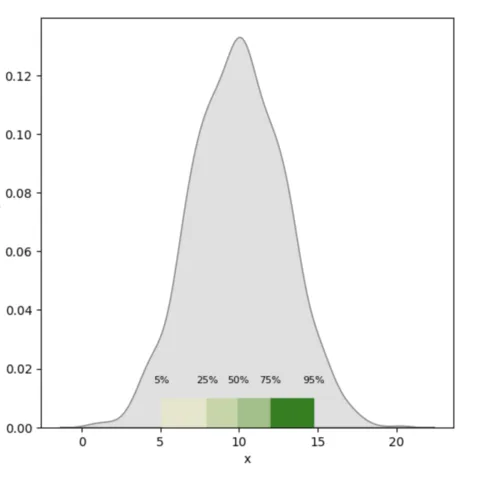
Density chart with quantiles displayed

Density chart with quantiles displayed

⚠️ Avoid the 61 most common dataviz mistakes

Boxplots hiding information, pie charts, cut axes, spaghetti charts... I gathered the 61 dataviz caveats I see the most as a deck of cards. Each card shows a chart that is not ideal, and a better alternative.

Get the full deck for free:

I respect your privacy. Unsubscribe anytime.

Dataviz caveat card: Histograms: mind the bin size
61
cards

Seaborn logoDensity charts, Seaborn and multiple groups

It is a common use case to compare the density of several groups in a dataset. Several options exist to do so.

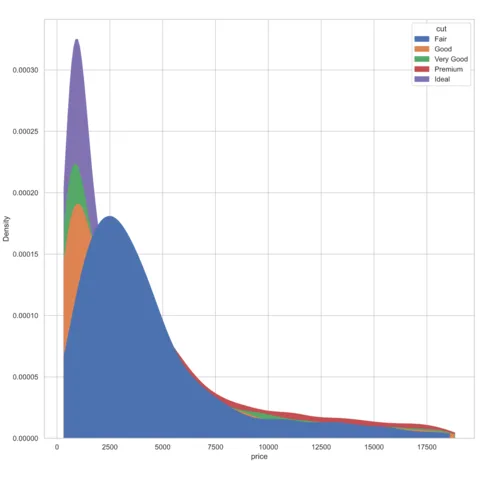
You can plot all items on the same chart, using transparency and annotation to make the comparison possible.

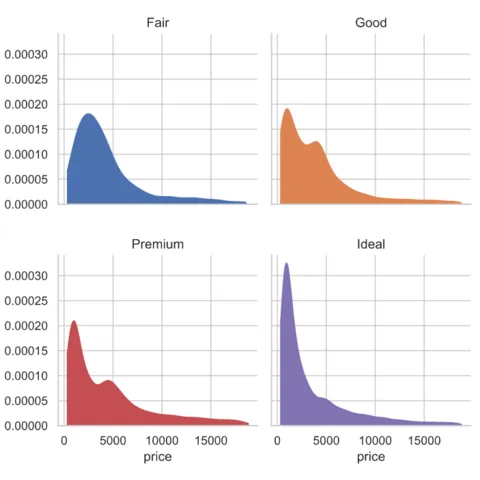
Or you can use a technique called small multiples where the graph window is split in individual charts, avoiding group overlaps that are sometimes hard to read.

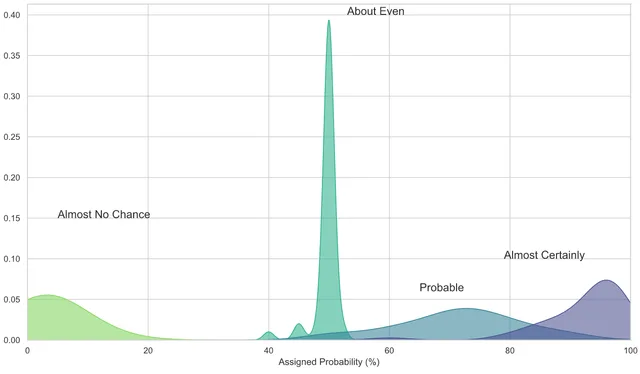
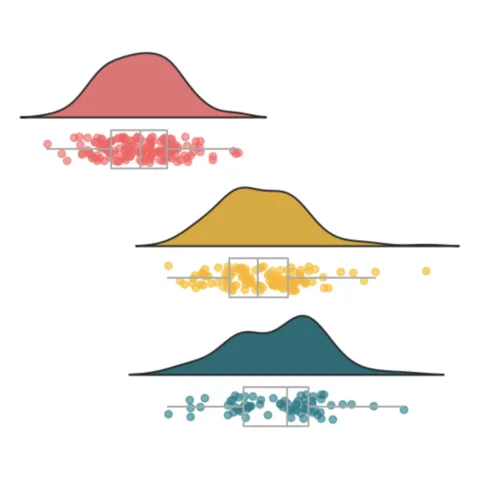
Density chart with multiple groups overlapped

Density chart with multiple groups overlapped

Density chart with multiple groups overlapped

Density chart with multiple groups overlapped

Density chart with multiple groups overlapped

Density chart with multiple groups overlapped

A density chart with multiple groups displayed, transparency and clean annotation.

A density chart with multiple groups displayed, transparency and clean annotation.

🔎 kdeplot() function parameters → see full doc

→ Description

The kdeplot() function of seaborn generates Kernel Density Estimates to depict the probability density function of a continuous variable. It outputs a smoothed curve representing the distribution of the data.

→ Arguments

Description

Dataframe-like (pandas, numpy, polars...) with the columns we want to plot.

Possible values → dataframe

It just has to be a pandas.DataFrame (columns are variables), numpy.ndarray (rows/columns are variables), or any mapping/sequence (dictionaries/lists)

Supports both long-form (each variable in its own column) and wide-form (variables in separate columns; reshaped internally).

Code Example

# Library & Dataset
import seaborn as sns
df = sns.load_dataset('iris')

# Plot
sns.kdeplot(data=df, x='sepal_width')
More about the kdeplot() function.

More about the kdeplot() function.

Matplotlib logo Density charts with Matplotlib
It is possible to build a density chart with matplotlib, but it is truely a struggle compared to making it with seaborn as shown above.

Here is an example to prove it is doable, but I strongly advise to go for seaborn.

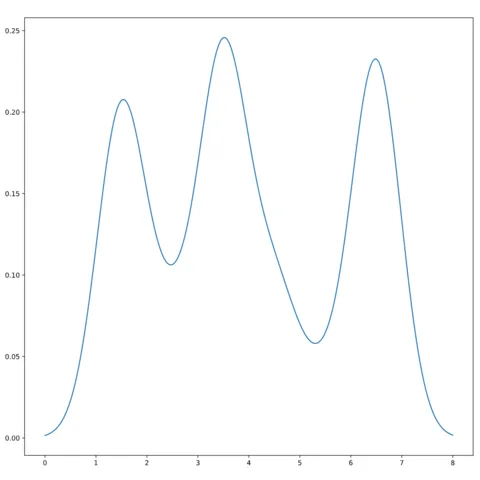
Basic density chart with python and matplotlib from a vector of data

Basic density chart with python and matplotlib from a vector of data

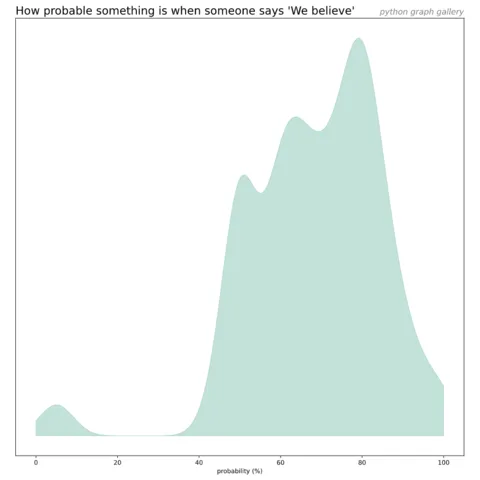
Read a csv file and plot the density of a column

Read a csv file and plot the density of a column

Combining density and boxplot

Combining density and boxplot

Density chart with quantiles displayed

Density chart with quantiles displayed

Related chart types

logo of a chart:Violin

Violin

logo of a chart:Density

Density

logo of a chart:Histogram

Histogram

logo of a chart:Box1

Boxplot

logo of a chart:Joyplot

Ridgeline

logo of a chart:Beeswarm2Big

Beeswarm

300 projects

💡 Out of dataviz inspiration?

I have spent years collecting the most beautiful data visualizations out there. Get the list of my top 300 dataviz projects, hand-picked, for free.

I respect your privacy. Unsubscribe anytime.

You are visitor 01402503 — GeezerVison does not store the pages you look up.
Best viewed with Netscape Navigator 4.7 or Internet Explorer 6 at 800×600. No cookies required.