GeezerVisonThe World Wide Web, restored to 800 pixels of glory. |
| Home|About|Gaming cabinet|Archives|How it works|Starter sites |
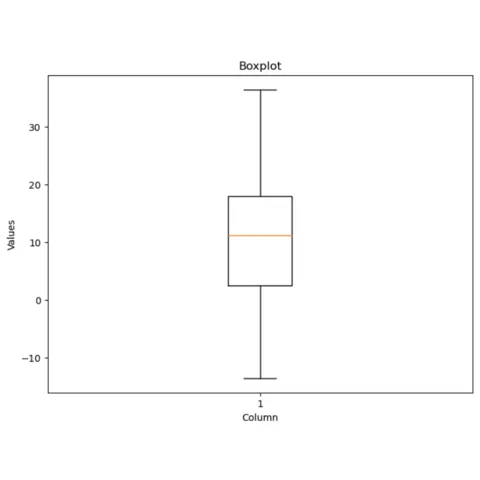
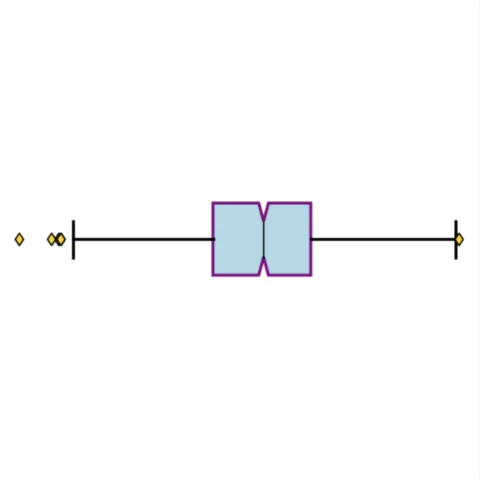
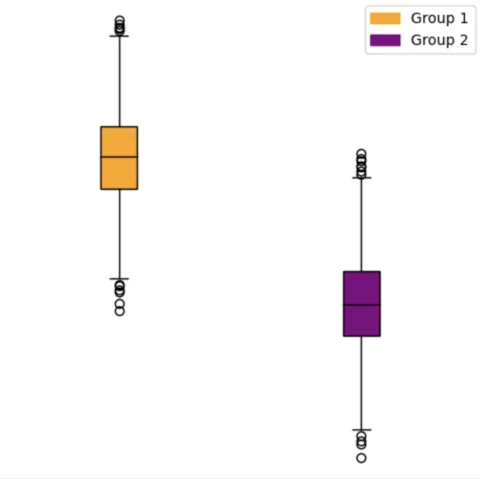
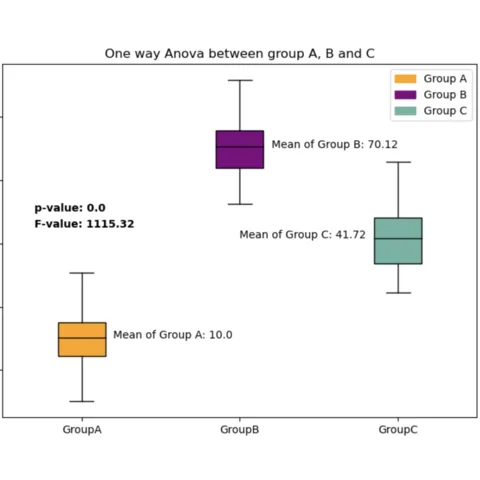
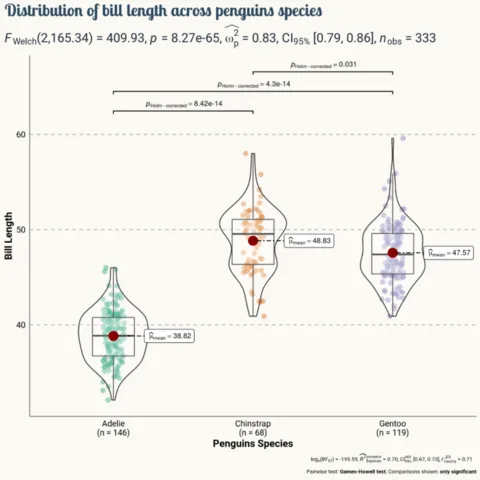
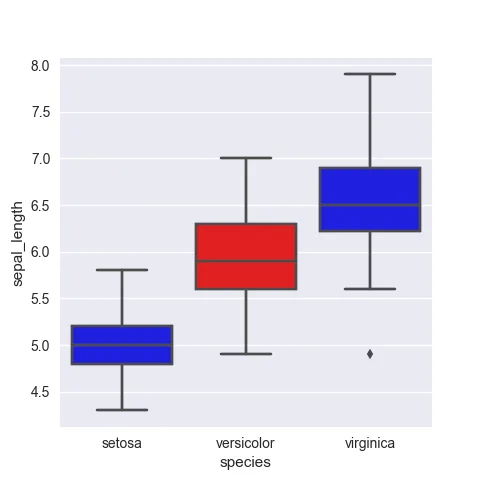
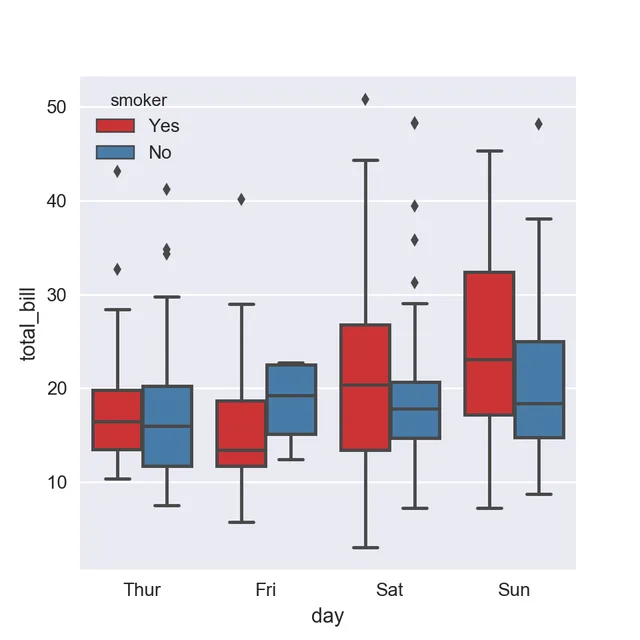
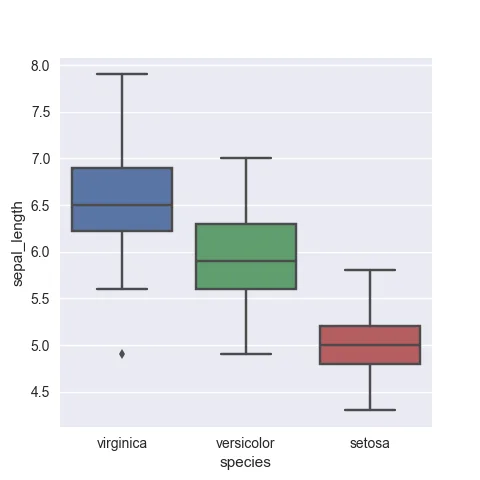
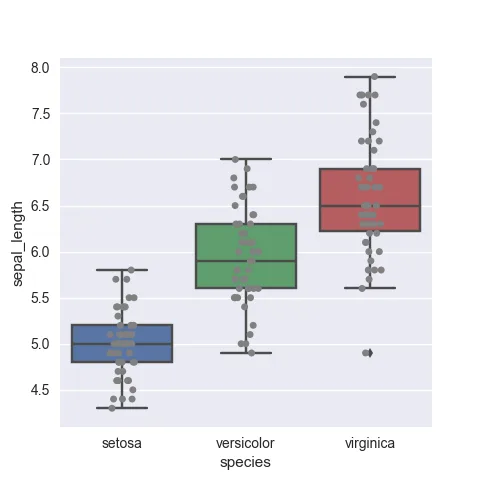
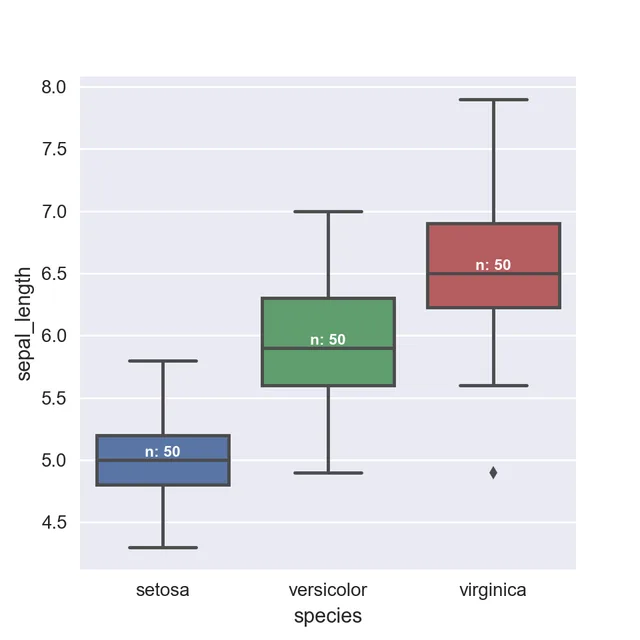
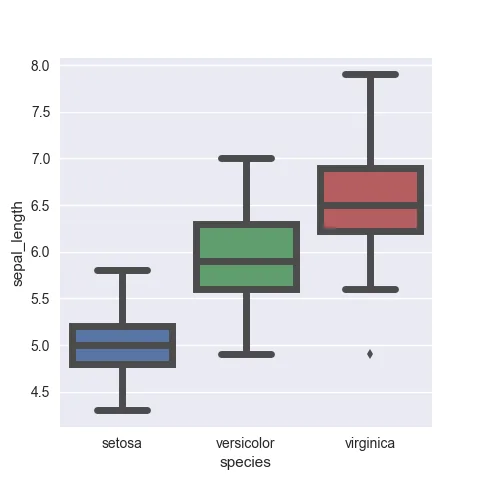
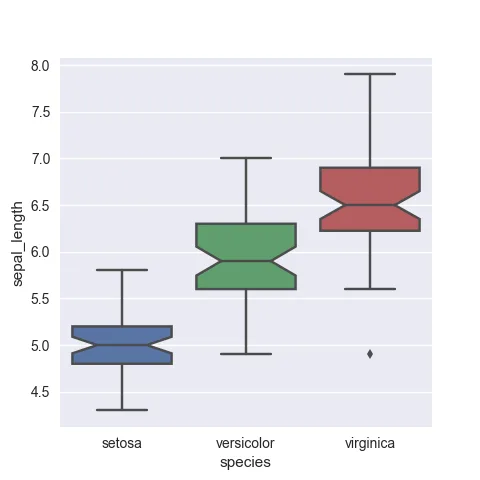
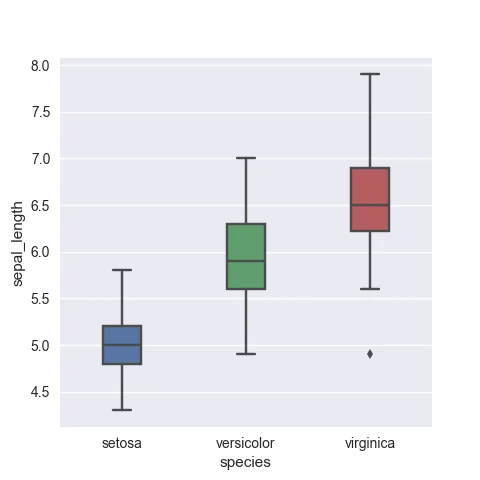
GeezerVison is showing python-graph-gallery.com — Python Boxplot Gallery | Dozens of examples with code Boxplot A boxplot summarizes the distribution of a numeric variable for one or several groups. It allows to quickly get the median, quartiles and outliers but also hides the dataset individual data points. In python, boxplots can be made with both seaborn and matplotlib as they both offer a ⏱ Quick start
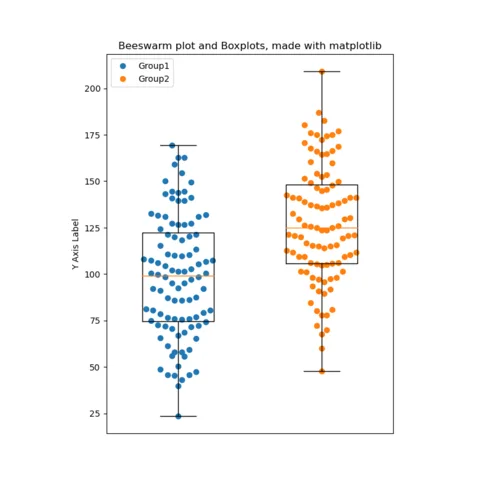
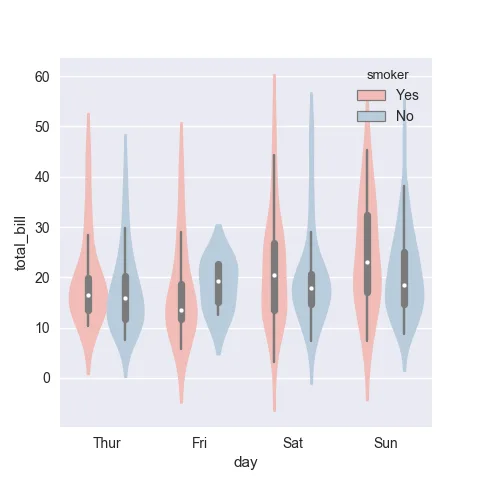
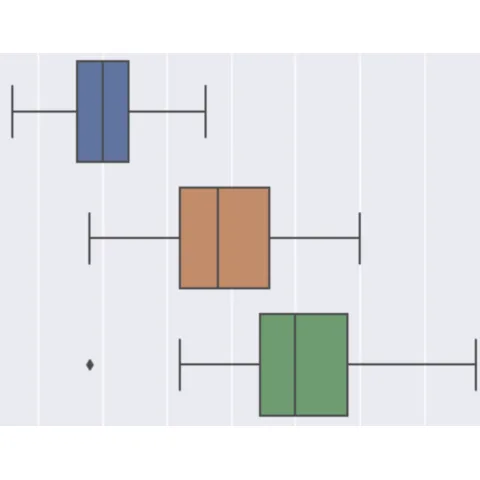
⚠️ Mind the boxplotA boxplot is an awesome way to summarize the distribution of a variable. However it hides the real distribution and the sample size. Check the 3 charts below that are based on the exact same dataset. To read more about this, visit data-to-viz.com that has a dedicated article. 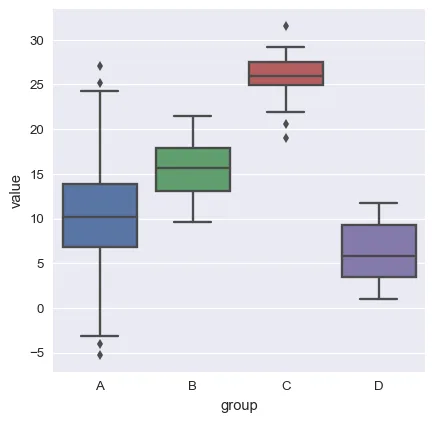 Basic boxplot. You can quickly read the median, quartiles and outliers of each group. 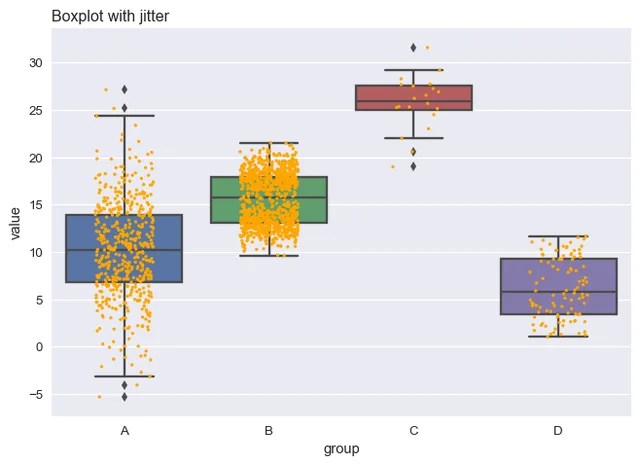 If you add individual points with jitter, a bimodal distribution appears for group B 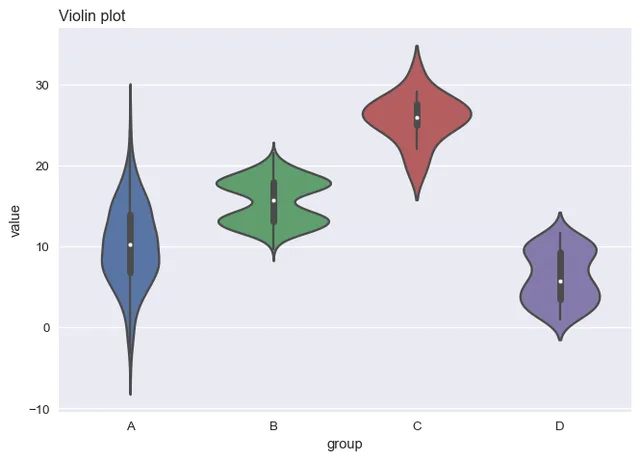 If you have a very large dataset, the violin plot is a better alternative than jittering
|
| You are visitor 01402503 — GeezerVison does not store the pages you look up. Best viewed with Netscape Navigator 4.7 or Internet Explorer 6 at 800×600. No cookies required. |
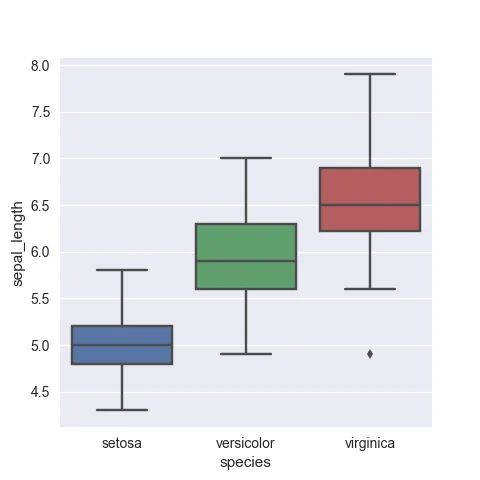
 Boxplots with
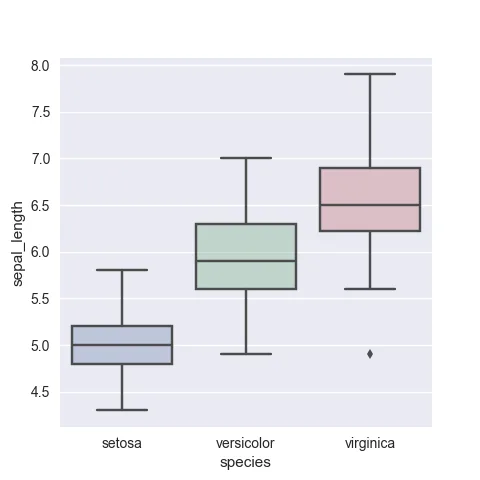
 Boxplots with