GV

GeezerVison

The World Wide Web, restored to 800 pixels of glory.

Home|About|Gaming cabinet|Archives|How it works|Starter sites

On this site

  • All
  • Best
  • Libs
  • Learn

This view

  • Original page
  • New address

GeezerVison is showing python-graph-gallery.com — Background Map

Background Map

logo of a chart:Map

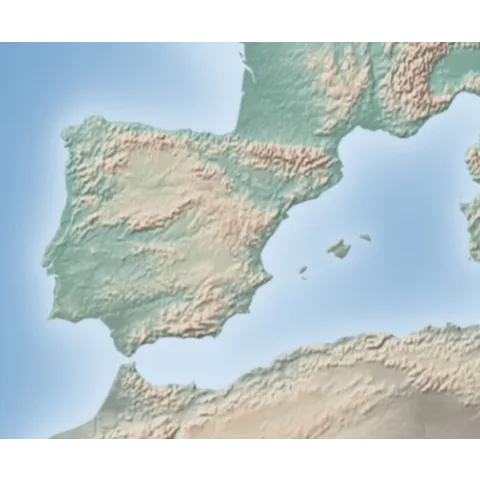
The first step of any geo-spatial data analysis is to draw the background map of the area of interest. This section explains what are the main ways to build it with Python. It is the foundation of the next sections that will add some data on top of it.

Map sectionAbout this chart

🔎 Input format and package overview ⭐

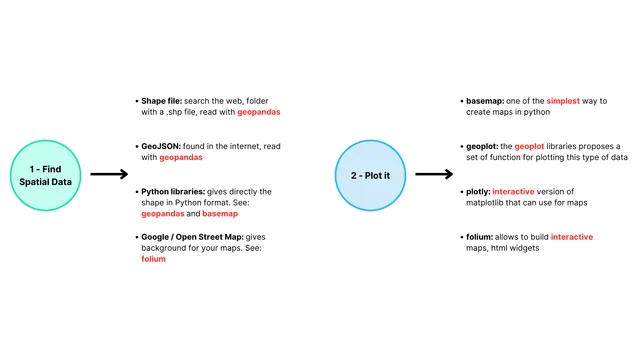
A map is basically a set of polygons displayed on a 2 dimensional canvas. There are two problems you need to solve when building one:

Anatomy of a matplotlib chart: all the basic vocabulary you need to know to understand the documentation properly

Anatomy of a matplotlib chart: all the basic vocabulary you need to know to understand the documentation properly

  • Where to find polygon coordinates. It can come from:
    • a shape file or a geoJson file. That's 2 different ways to store the information. The geopandas package is the best way to read those file formats with Python.
    • a python library like geopandas or basemap providing the information for common location like the US.
    • google map or open street map.

  • How to plot those polygons?
    • Once you get a geodataframe thanks to the geopandas package, geoplot is your best choice to build a static map
    • If you need an interactive map from a geodataframe, plotly is a good option.
    • If you want to use google map style maps, folium is the way to go.

GeoPlot & Cartopy

GeoPlot is an extension of Cartopy and Matplotlib to create maps with minimal efforts.

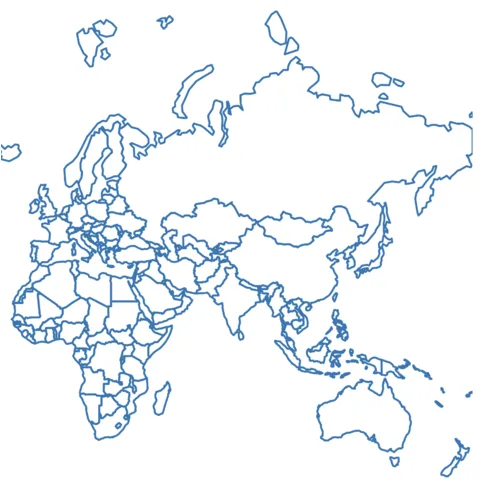
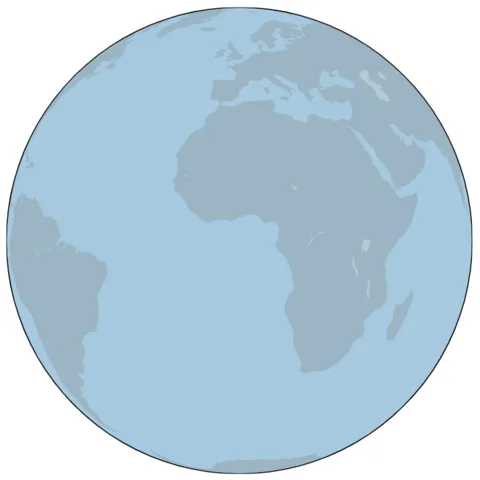
Initiate a background map

Initiate a background map

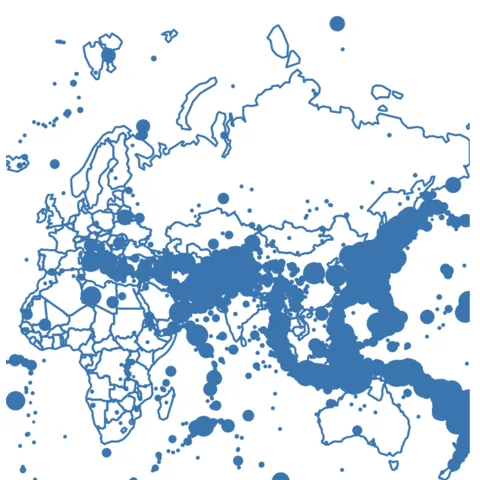
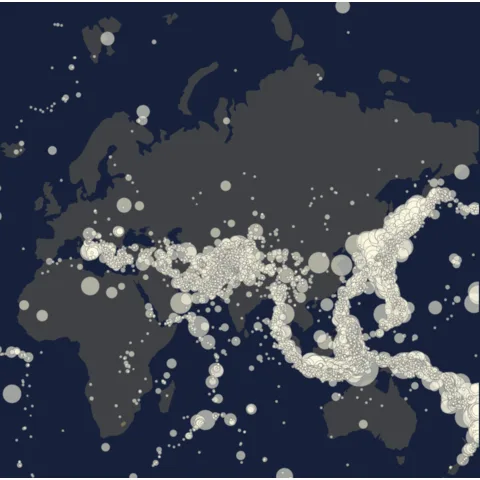
Add bubble on top of a background map

Add bubble on top of a background map

Customize style and colors in bubble maps

Customize style and colors in bubble maps

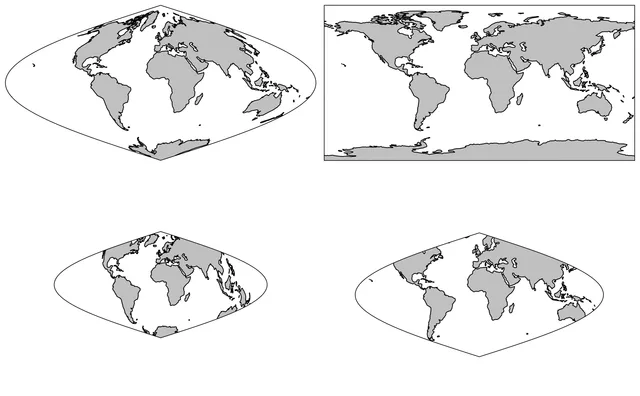
When creating maps, there are a large number of possible projections. The article below explains how to modify them.

Change projection in maps

Change projection in maps

⚠️ Avoid the 61 most common dataviz mistakes

Boxplots hiding information, pie charts, cut axes, spaghetti charts... I gathered the 61 dataviz caveats I see the most as a deck of cards. Each card shows a chart that is not ideal, and a better alternative.

Get the full deck for free:

I respect your privacy. Unsubscribe anytime.

Dataviz caveat card: Maybe you don't need a map
61
cards

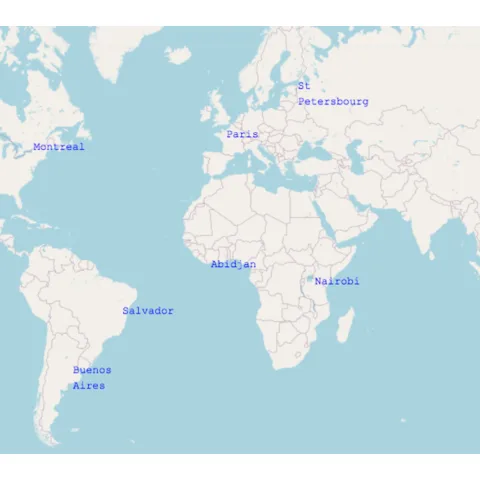
Folium for google maps style maps

Folium is a wrapper of the leaflet.js javascript library. It allows to make all the data wrangling with python, and benefit the power of javascript for interactive data visualization.

The map below has been created with folium... with 1 line of code only! 😍

See code

Folium allows different types of background tiles. Here is an example with a tile called Cartodb Dark Matter:

See code

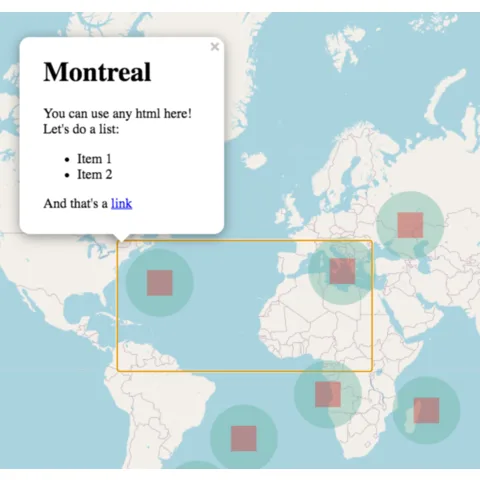
It is also possible to add markers with associated popups on top of the map:

How to read a geoJson file with geopandas and transform it to a geodataframe.

How to read a geoJson file with geopandas and transform it to a geodataframe.

How to read a geoJson file with geopandas and transform it to a geodataframe.

How to read a geoJson file with geopandas and transform it to a geodataframe.

Background map with Basemap

Seaborn is another great alternative to build an area chart with python. The below examples show how to start basic, apply usual customization, and use the small multiple technique for when you have several groups to compare.

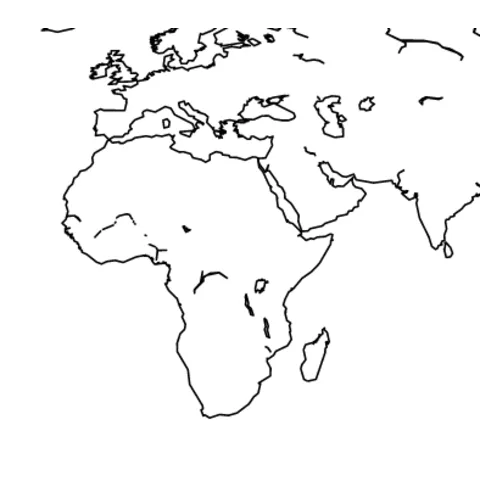
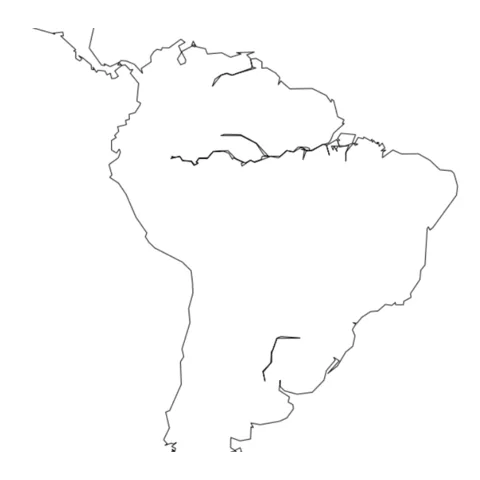
Most basic map with python and the basemap library.

Most basic map with python and the basemap library.

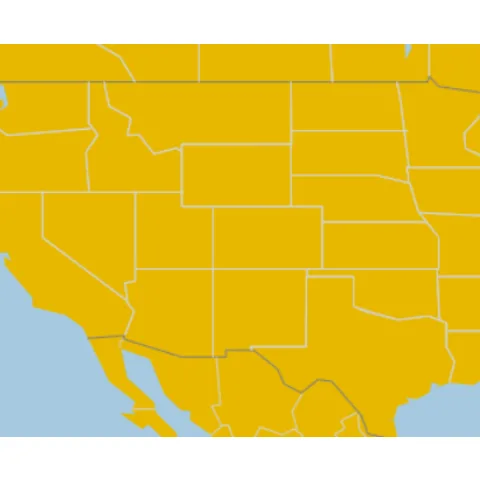
Select a specific location on the map.

Select a specific location on the map.

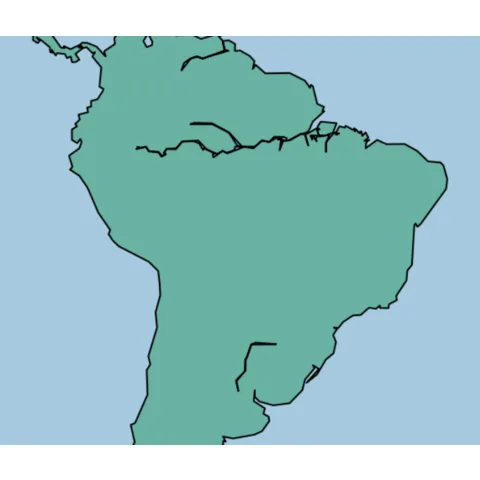
Customize color and features of shapes.

Customize color and features of shapes.

List of available boundaries.

List of available boundaries.

Change projection.

Change projection.

Use a background tile.

Use a background tile.

Related chart types

logo of a chart:Map

Map

logo of a chart:Choropleth

Choropleth

logo of a chart:MapHexbin

Hexbin

logo of a chart:Cartogram

Cartogram

logo of a chart:ConnectedMap

Connection

logo of a chart:BubbleMap

Bubble

300 projects

💡 Out of dataviz inspiration?

I have spent years collecting the most beautiful data visualizations out there. Get the list of my top 300 dataviz projects, hand-picked, for free.

I respect your privacy. Unsubscribe anytime.

You are visitor 01402503 — GeezerVison does not store the pages you look up.
Best viewed with Netscape Navigator 4.7 or Internet Explorer 6 at 800×600. No cookies required.