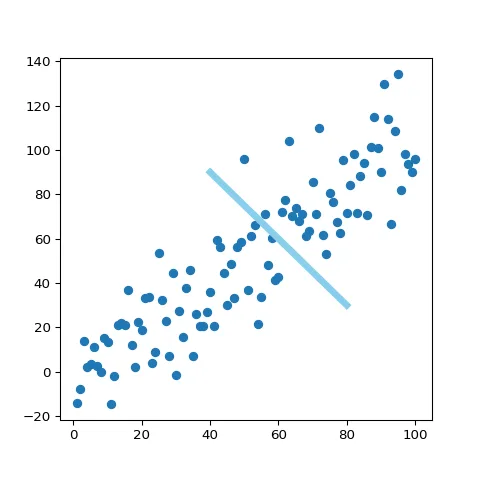
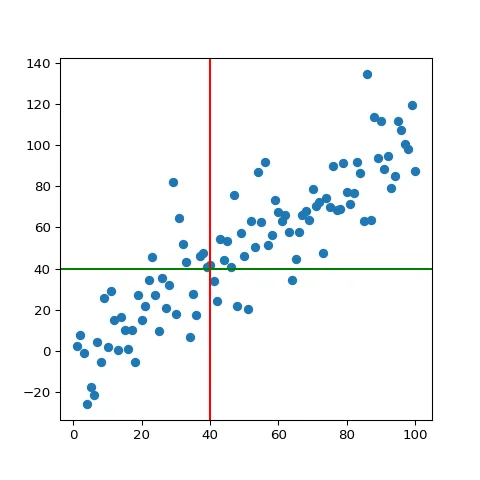
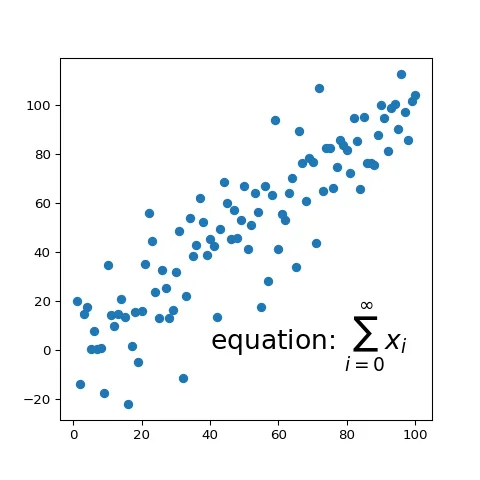
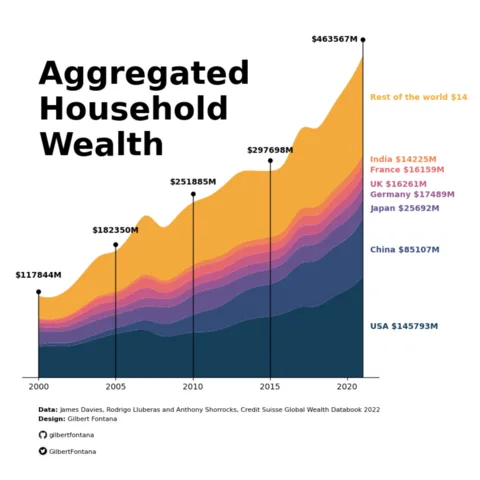
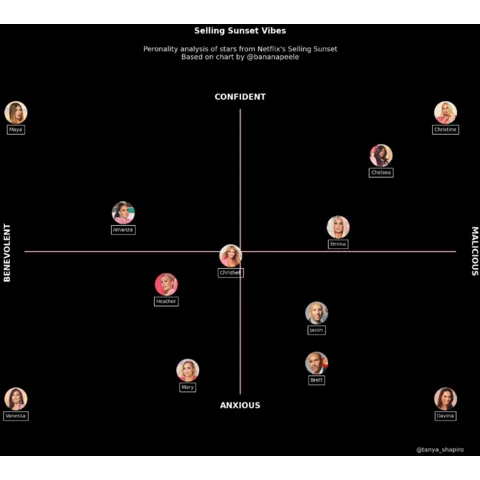
Matplotlib is the most famous library for data visualization with python. It allows to create literally every type of chart with a great level of customization. This page provides some general tips that can be applied on any kind of chart made with matplotlib like customizing titles or colors. If you're looking at creating a specific chart type, visit the gallery instead.
⏱ Quick start
Matplotlib is the most famous python data visualization library. It is widely used and most of other viz libraries (like seaborn) are actually built on top of it.
Once installed, matplotlib must be imported, usually using import matplotlib.pyplot as plt. You can then use use the functions available in the plt object.
# Library
import matplotlib.pyplot as plt

# Create data
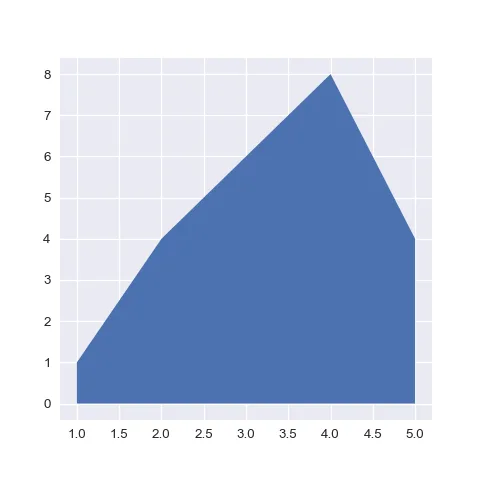
x = [1, 2, 3, 4, 5]
y = [1, 4, 6, 8, 4]

# Area plot
plt.fill_between(x, y)
plt.show()
 Basic vocabulary
The figure below describes the anatomy of a matplotlib charts. It names all the main components, names that you need to know to understand the documentation properly.
⚠️ Disclaimer: this figure comes from the very complete matplotlib documentation. Have a look at it for a thorough explanation on how this library works.
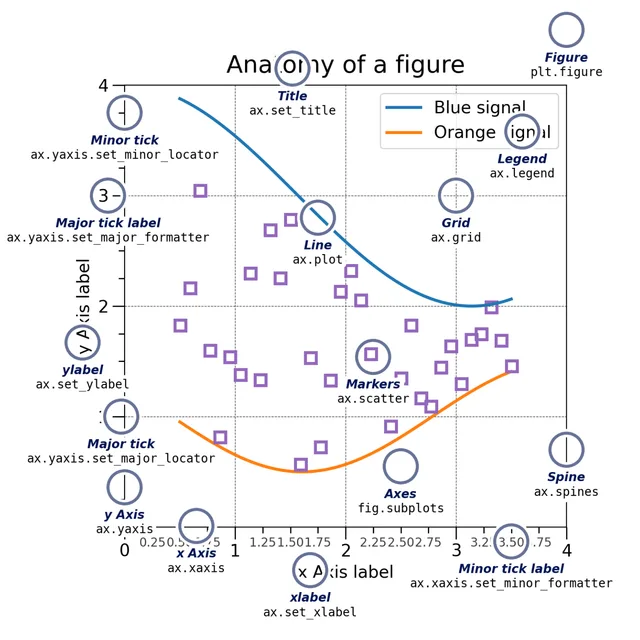
Anatomy of a matplotlib chart: all the basic vocabulary you need to know to understand the documentation properly
🤔 How to Learn Matplotlib
Matplotlib is a powerful library, but its syntax can be hard to master. If you want a deep understanding of how it works—and stop struggling to build your dream charts—check out my Matplotlib Journey project!
It is an interactive online course designed to turn you into a Matplotlib data visualization expert. It offers a clear, big-picture understanding of how plotting works in Python, making it easy to understand and adapt any example from the gallery.
Two distinct APIs
There are 2 main ways to build a chart with matplotlib: the pyplot API and the object-oriented API.
➡️ pyplot API
Pyplot is a collection of functions, each function applying a change to a figure. For instance, plt.barh() will build a barplot and plt.title() will add a title to it.
# import libraries
import pandas as pd
import matplotlib.pyplot as plt

# Create a data frame
df = pd.DataFrame ({'Group':  ['A', 'B', 'C', 'D', 'E'], 'Value': [1,5,4,3,9]})

# Create horizontal bars
plt.barh(y=df.Group, width=df.Value);

# Add title
plt.title('A simple barplot');
➡️ object oriented API
The object oriented API usually starts by initializing one Figure object and one or more Axes object using the subplot() function. Then the methods of those objects will be used to apply changes to the chart.
# import libraries
import pandas as pd
import matplotlib.pyplot as plt

# Create a data frame
df = pd.DataFrame ({'Group':  ['A', 'B', 'C', 'D', 'E'], 'Value': [1,5,4,3,9]})

# Initialize a Figure and an Axes
fig, ax = plt.subplots()

# Fig size
fig.set_size_inches(9,9)

# Create horizontal bars
ax.barh(y=df.Group, width=df.Value);

# Add title
ax.set_title('A simple barplot');
See how the syntax slightly differs between both options? (plt.title versus ax.set_title(). This is pretty confusing and I advise to have a look to the official documentation for a more thorough explanation. In the gallery, both APIs are used.
Customizing titles
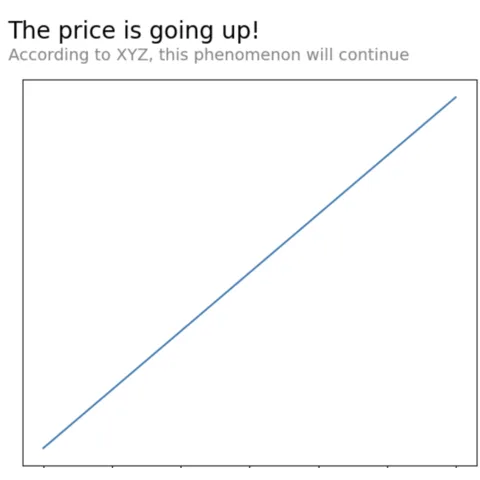
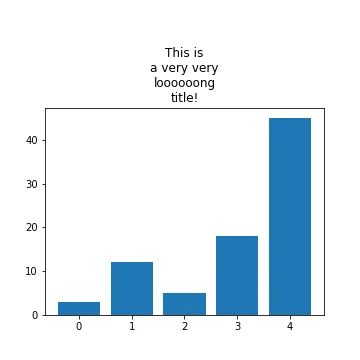
The title is a key part of a good chart. It has to summarize its key message in a few words. Always avoid to simply repeat what is displayed on each axis. Try to provide some more insight allowing to understand the main result instead.
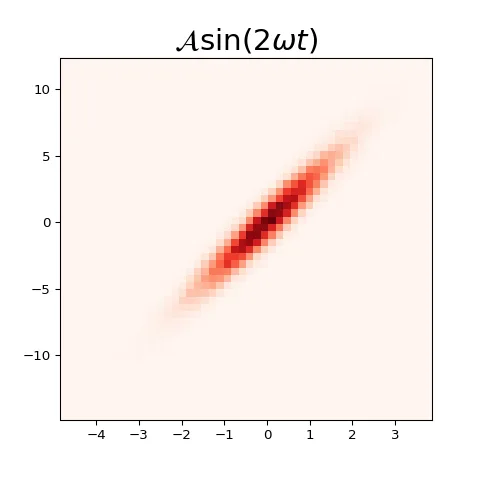
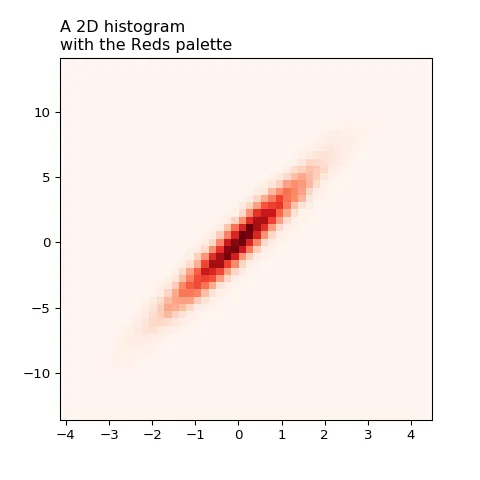
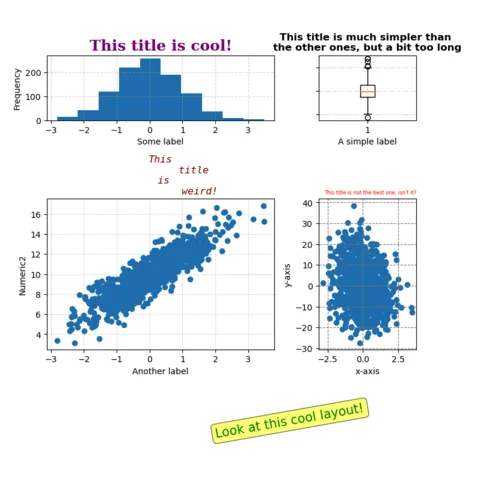
The post #190 goes in depth on how to customize the matplotlib title. All the main types of change are descried: changing its color, adding a subtitle, using math formulas and so on. Give it a go!
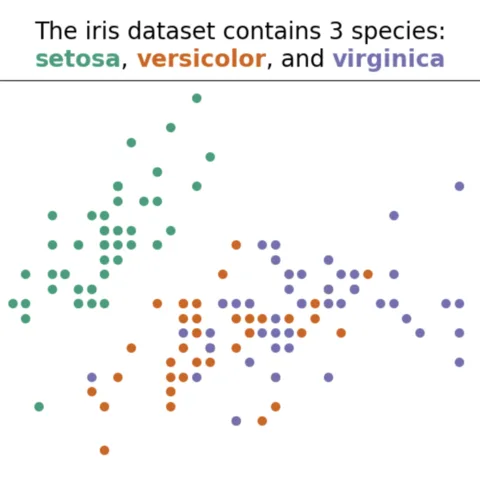
An effective method in data visualization involves utilizing the title as a legend, facilitated by the highlight_text package. The subsequent two posts provide an introductory overview of this package:
Annotation
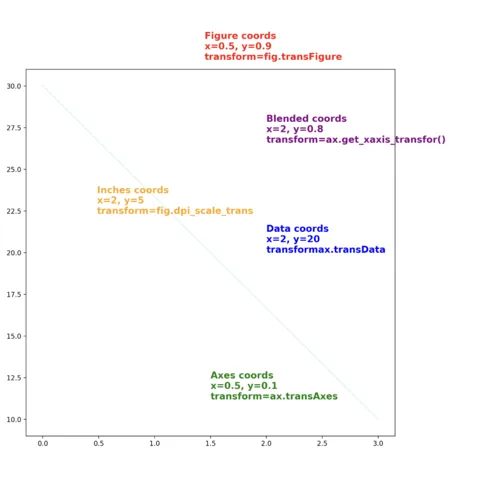
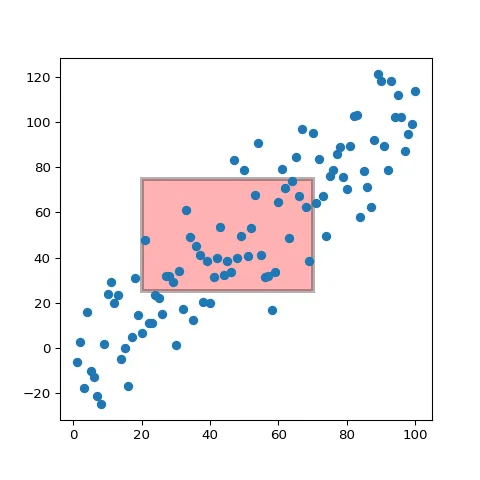
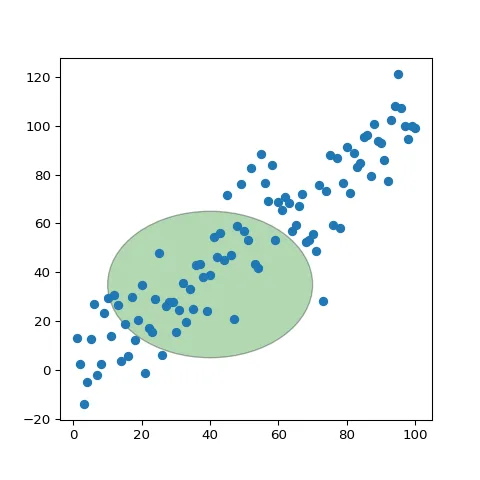
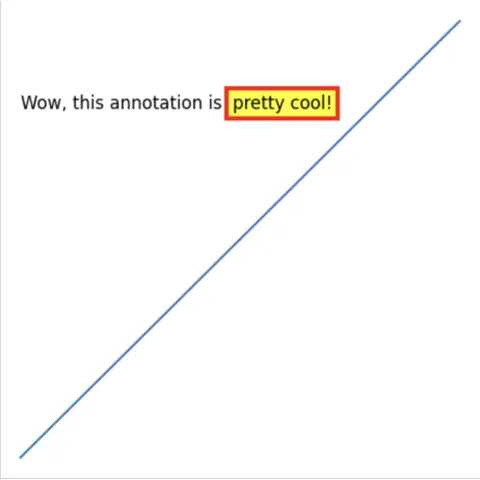
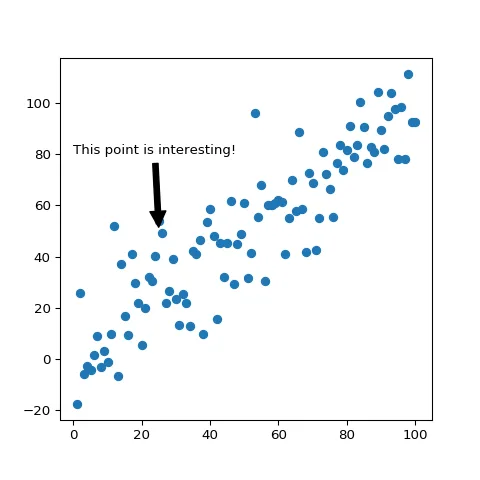
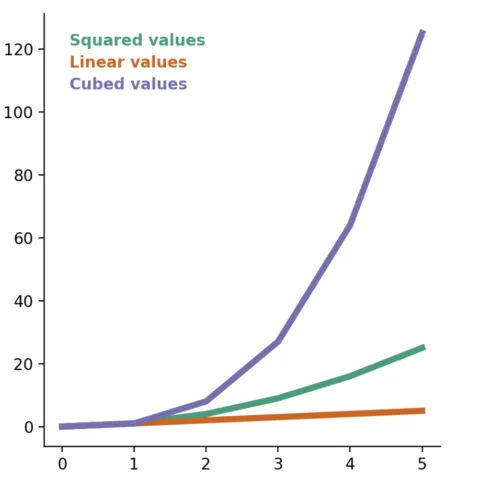
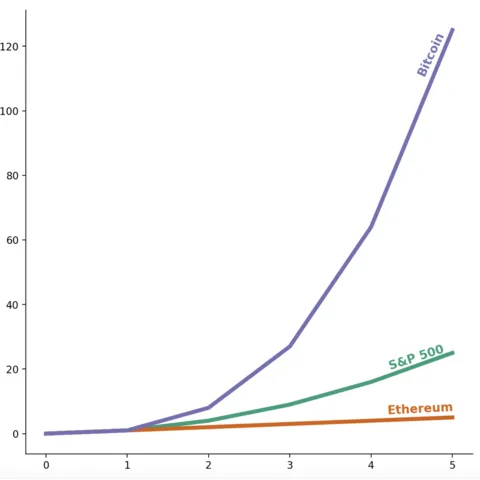
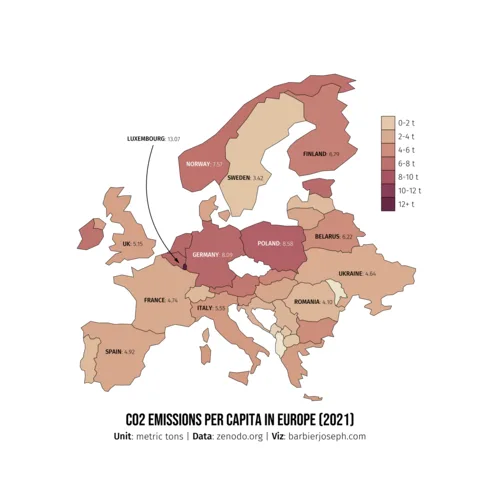
Annotation is a key part of a great visualization. It transforms a simple chart in a whole piece of story telling. Before you share your graph with anyone, make sure the key insight are highlighted with labels, shapes or color.
All those kind of annotation are built thanks to various matplotlib functions like annotate() or add_patch(). The blogposts showcased below should get you started with it.
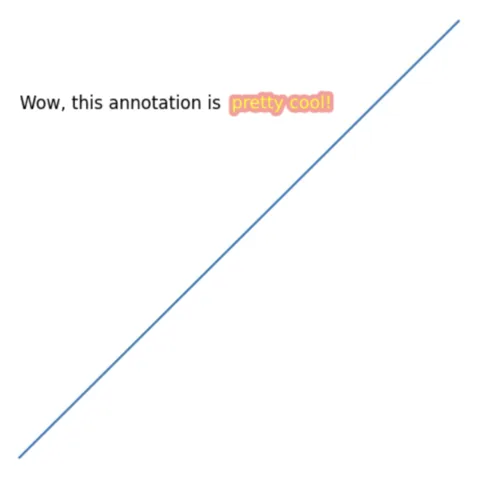
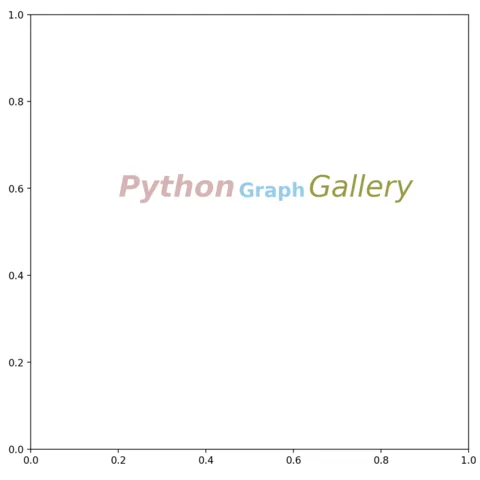
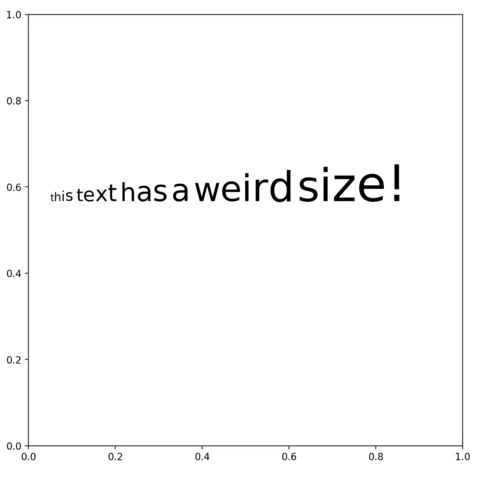
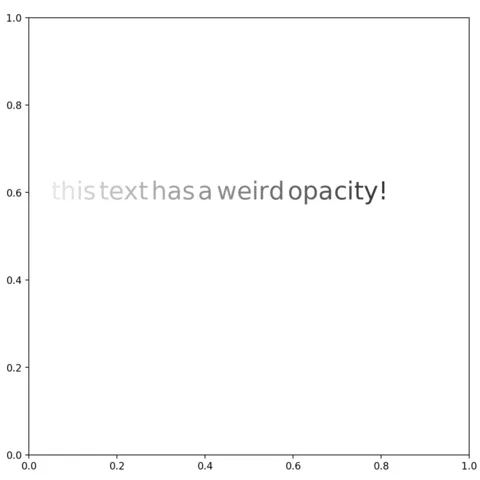
The main problem with matplotlib annotations is that you can't have different font styles (color, weight, size...) inside a same annotation. And this is a big issue because highlighting text has a major role in data visualization.
Fortunately for us, the highlight_text package exists! And it makes the process of creating beautiful annotations much easier. Check the examples below:
A similar tool to highlight_text is flexitext. The core difference relies on the syntax used, where flexitext has something more similar to HTML compared to highlight_text.
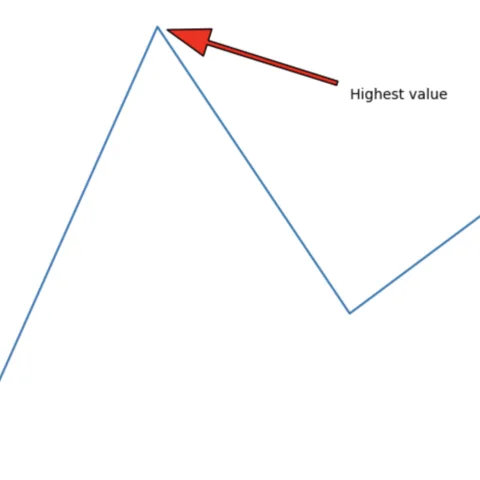
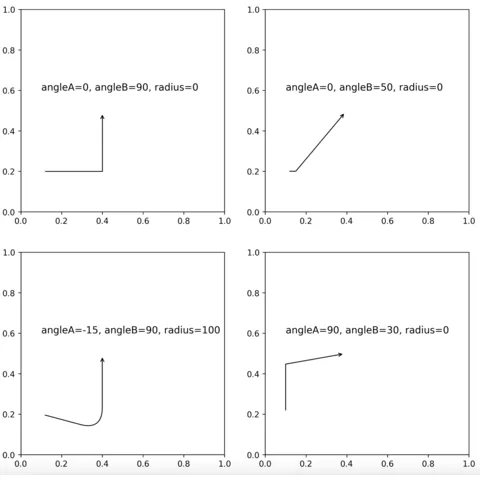
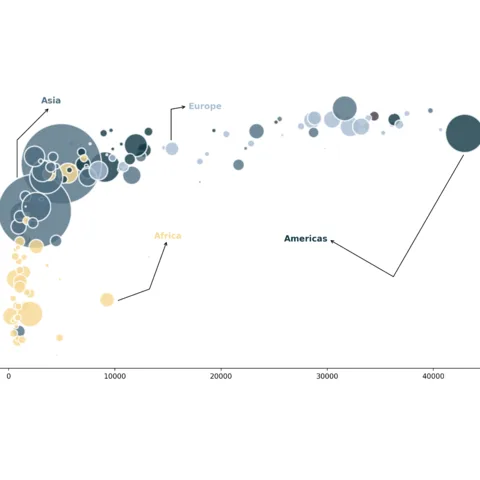
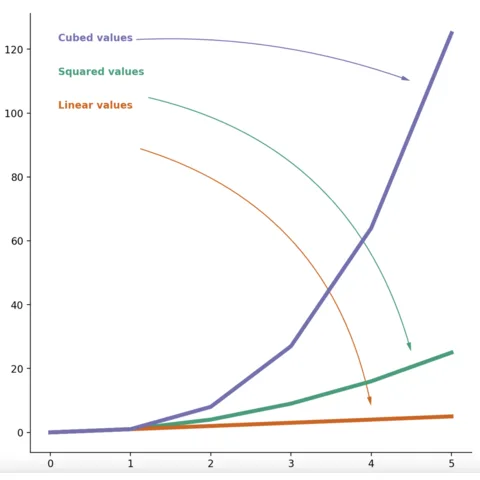
 Arrows
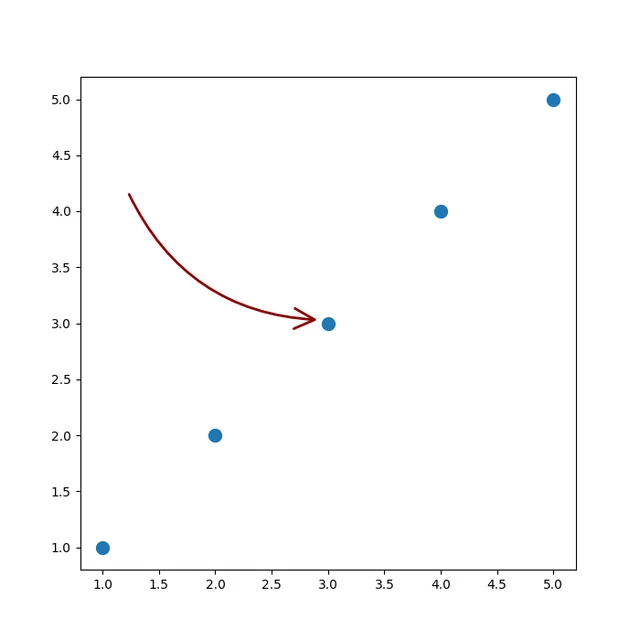
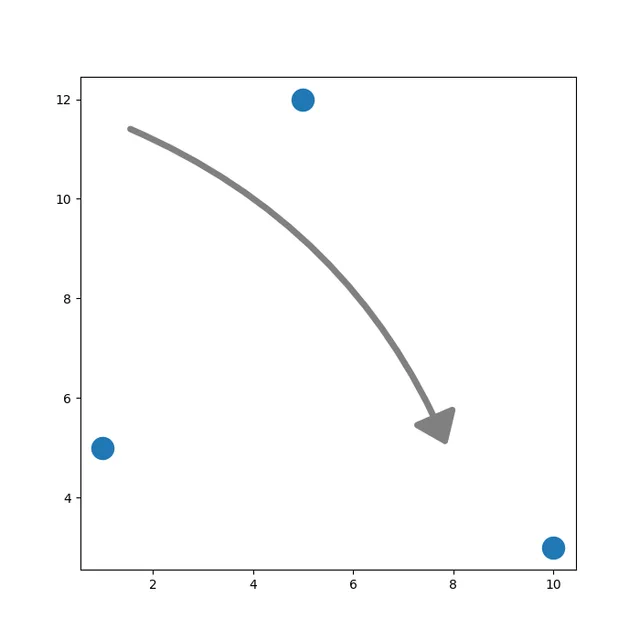
Matplotlib offers built-in arrow functions like annotate() and FancyArrowPatch(). For full customization, though, the drawarrow library is a more straightforward option.
The following posts will guide you in creating any arrow you need using both Matplotlib functions and those from drawarrow.
🔎 fig_arrow() function parameters → see full doc
→ Description
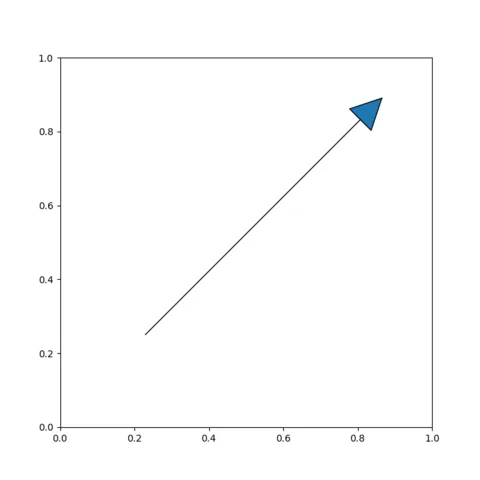
The fig_arrow() function of drawarrow add an arrow on a given matplotlib figure. All the arguments described here also work with the ax_arrow() function.
Description
Array-like of length 2 specifying the tail position of the arrow on the figure.
Possible values → list
The first value is the x-axis position, and the second value is the y-axis position.
Code Example
import matplotlib.pyplot as plt
from drawarrow import fig_arrow

fig, ax = plt.subplots()
fig_arrow(
  tail_position=[0.3, 0.3],
  head_position=[0.8, 0.8]
)

plt.show()
✨ Cheatsheets
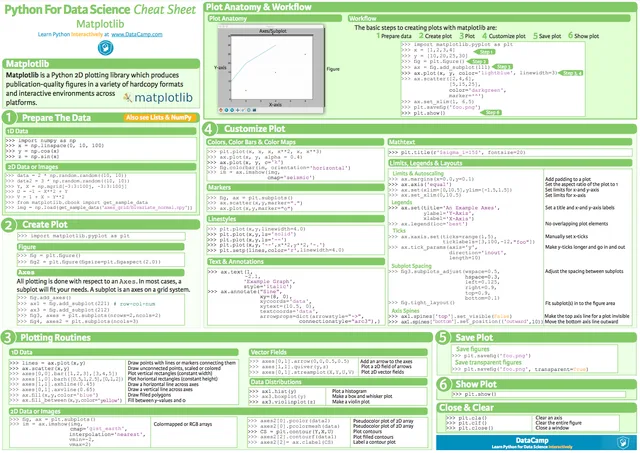
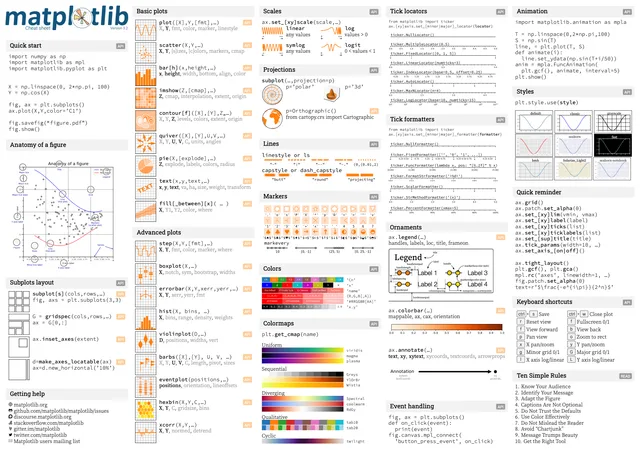
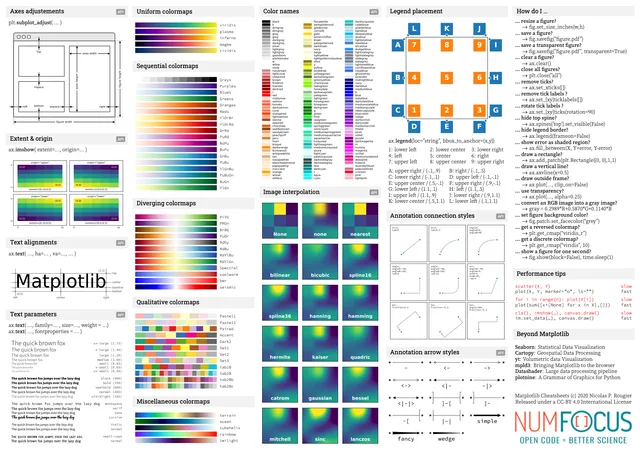
It's pretty hard to remember all the matplotlib associated vocabulary. The cheatsheet section is here to help, with a few sheets that you'll probably want to use on a daily basis.
 Custom fonts
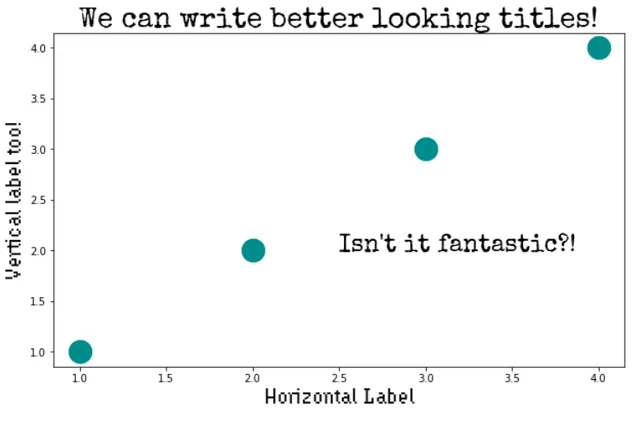
Using custom fonts adds a nice touch to your graph and make it shine among all the other plots using defaults. The simplest way to customize your fonts is with the PyFonts library, which lets you load any font from the web with just a single line of code!
The blog post below will walk you through using PyFonts or installing and applying a local font with matplotlib functions.
Add margin around a matplotlib chart
It is a common struggle to deal with the margins around the chart. Fortunately this is pretty straightforward thanks to the subplots_adjust() function as explained in the examples below.
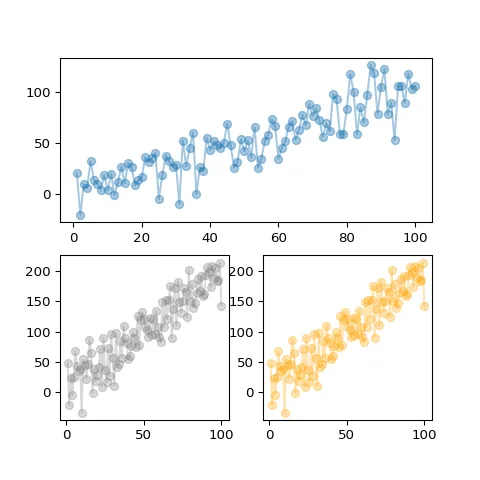
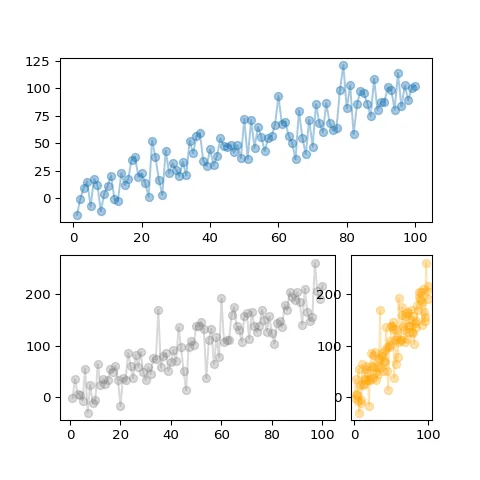
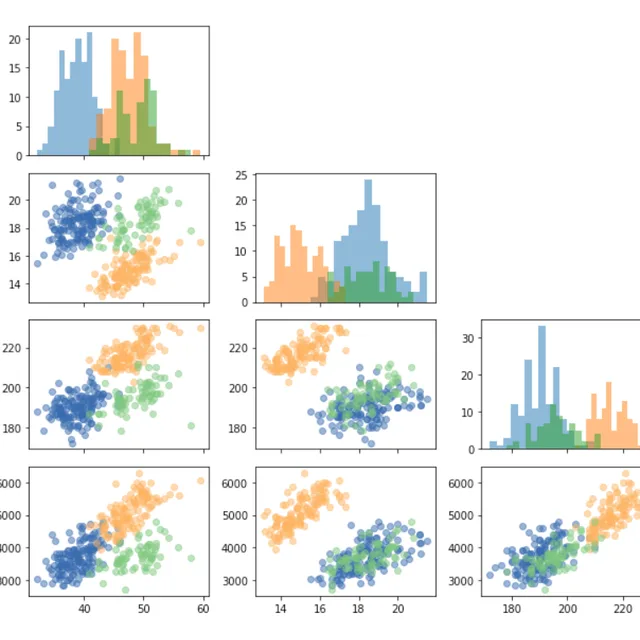
Split the figure in subplots
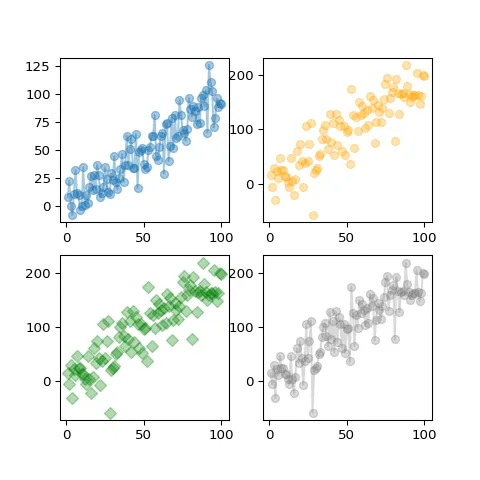
It can be really useful to split your graphic window in several parts, in order to display several charts in the same time. The subplot() function of matplotlib allows to do it quickly with a great level of customization.
Additional note: how to remove some unused entries in a grid using the ax.remove() function:
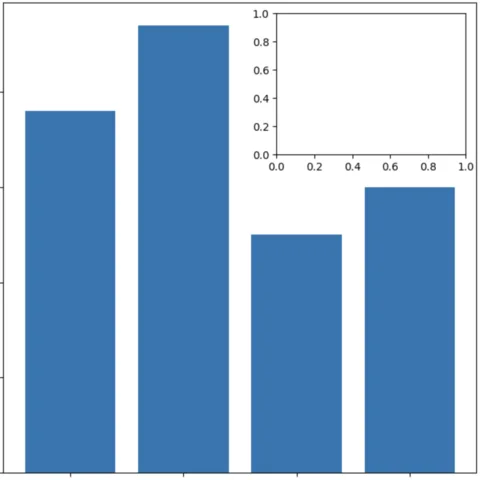
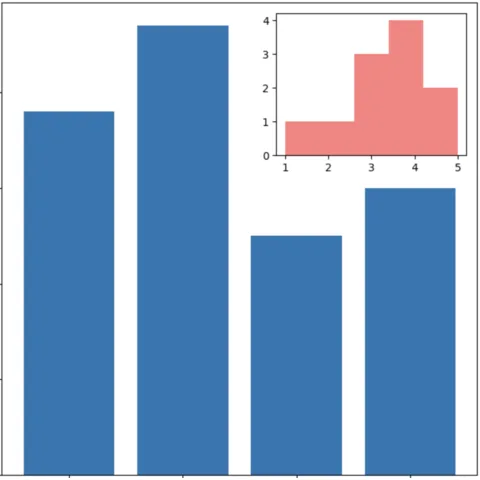
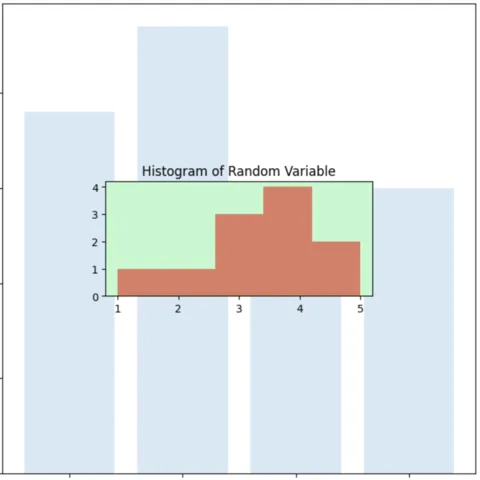
Adding a secondary graph within the main graph area can be a powerful technique to add context to you figure. This is totally doable using the inset_axes() function as suggested in the examples below:
Available style sheets
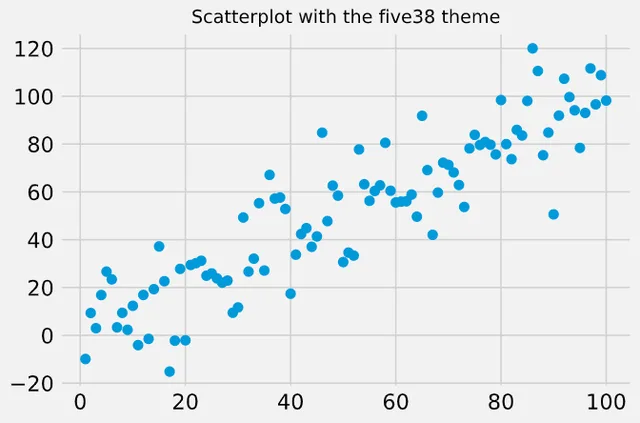
Matplotlib comes with a set of 26 pre-built themes to style your chart easily. This post is dedicated to this feature, explaining how to use plt.style.use() to pick a theme up.
We recommend you to use the morethemes package if you want to use beautiful themes inspired by famous journals.
Customizing axis
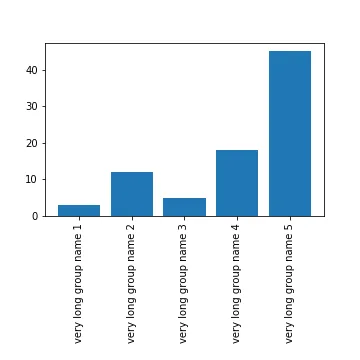
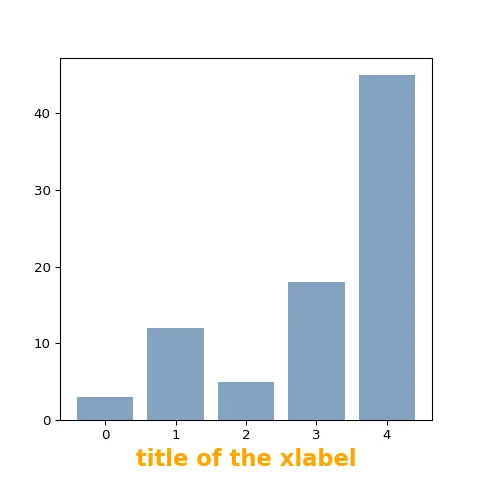
Matplotlib allows every kind of axis configuration. It is mainly done thanks to the tick_params(), xticks() and xlabels() functions. The post #191 will guide you through all the possibilities.
Customizing the legend
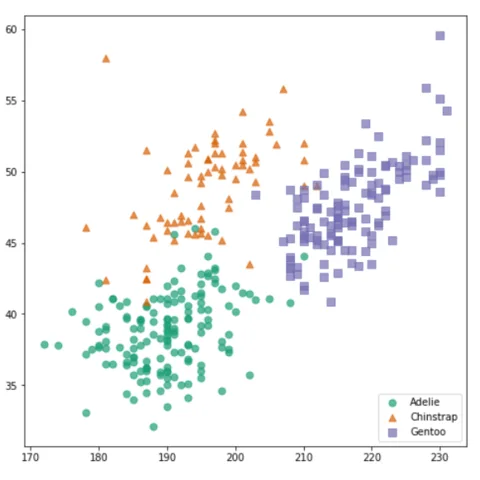
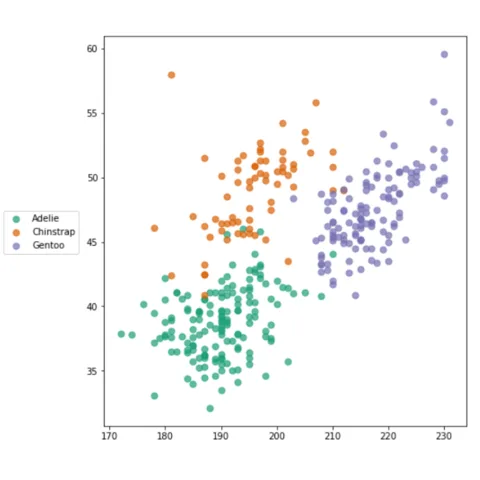
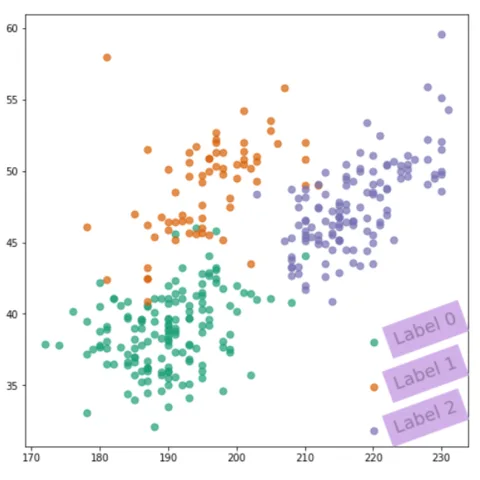
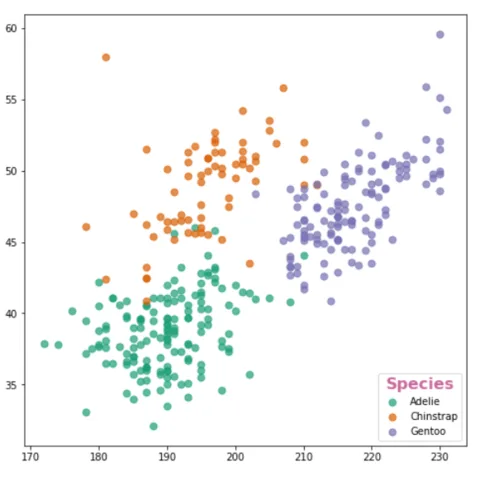
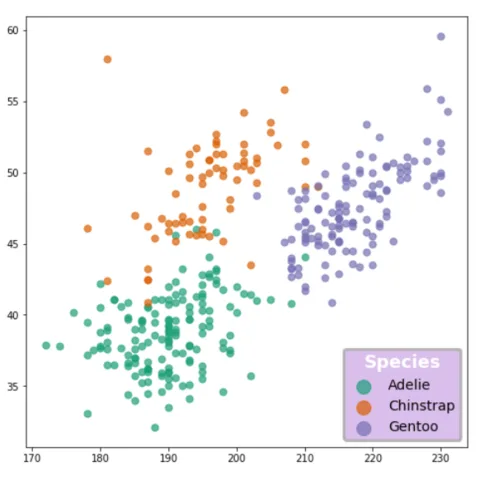
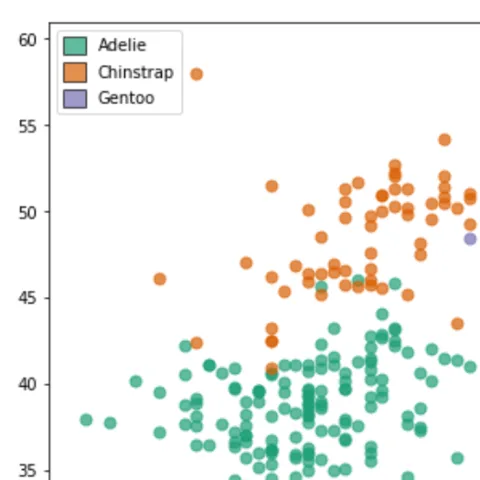
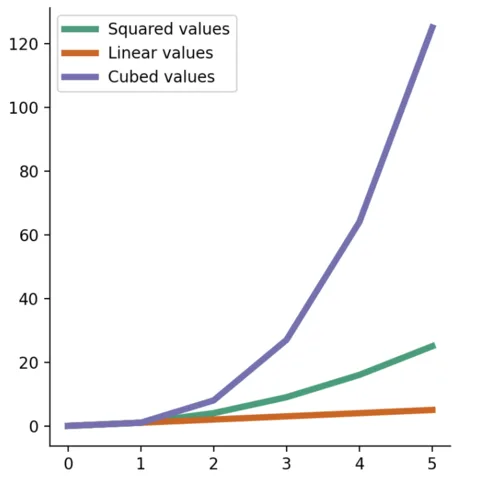
If you have several colors or marker on your chart, you can't escape the hassle of building a nice legend. The blogpost linked below should help for all the most common use cases like positioning the legend, adding and customizing a title to it, controling markers and labels and more.
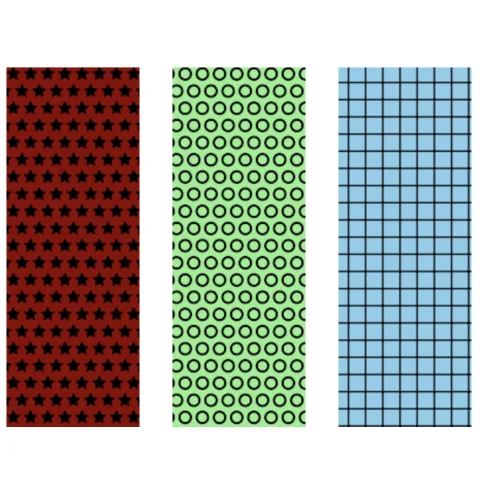
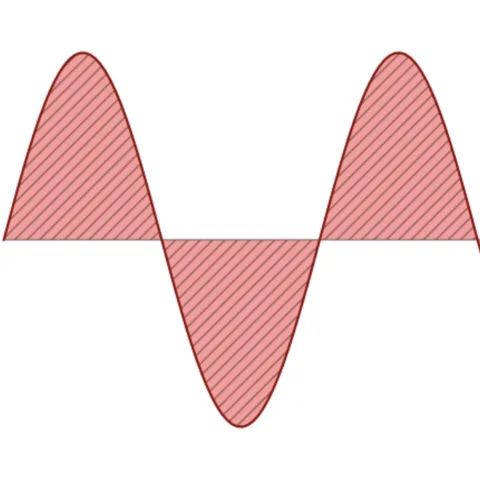
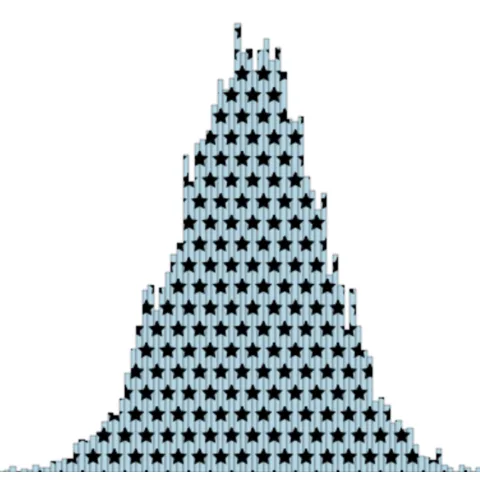
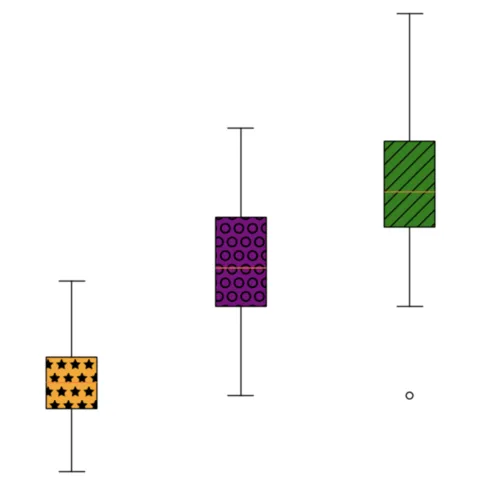
Patterns in charts
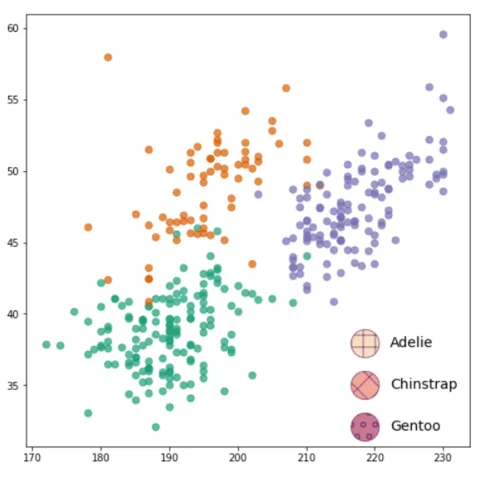
Hatchs and patterns are a great way to enhance the readability of your chart. The post below will guide you through the process of adding patterns to different types of charts.
Insert images in a matplotlib graph
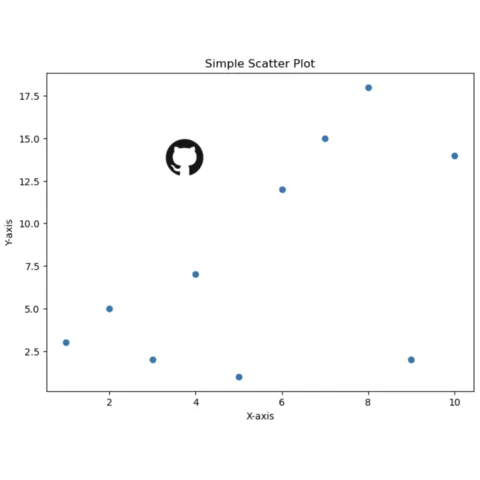
It can be very useful to insert one or several images in a matplotlib graph. It can be used for the graph caption or even inside the chart area to provide more context.
Please find below a complete tutorial explaining how to proceed using the PIL and io libraries, and a real life usage of this technique to produce a beautiful & polished figure.
300 projects💡 Out of dataviz inspiration?
I have spent years collecting the most beautiful data visualizations out there. Get the list of my top 300 dataviz projects, hand-picked, for free.
I respect your privacy. Unsubscribe anytime.