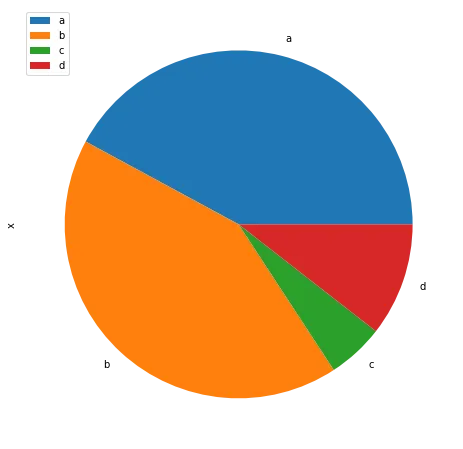
Most basic pie chart with Matplotlib
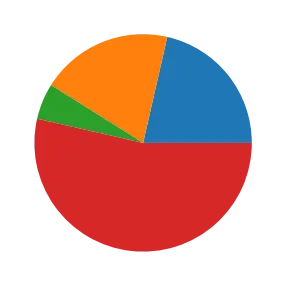
The matplotlib library allows to easily build a pie chart thanks to its pie() function. It expects at the very least some data input. This data must be an array of numbers as in the example below:
# library
import matplotlib.pyplot as plt
plt.rcParams["figure.figsize"] = (20,5)
# create random data
values=[12,11,3,30]

# Create a pieplot
plt.pie(values);
plt.show();
Add labels
The above pie chart is a good start but is definitely not very insightful. The first thing we miss here are labels.
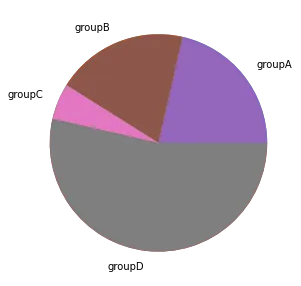
Labels are added thanks to the labels parameter that expect an array of strings. You also problably want to play with the labeldistance parameter that controls the distance between the circle edge and the label itself. (1= exactly on it, use something bigger to have the label further.)
# library
import matplotlib.pyplot as plt

# create random data
names='groupA', 'groupB', 'groupC', 'groupD',
values=[12,11,3,30]

# Create a pieplot
plt.pie(size_of_groups)

# Label distance: gives the space between labels and the center of the pie
plt.pie(values, labels=names, labeldistance=1.15);
plt.show();Customize wedges
It is pretty common to customize wedges to get some blank spaces around them. This is doable thanks to the wedgeprops parameter. This parameter is an object that accept 2 properties: linewidth and edgecolor
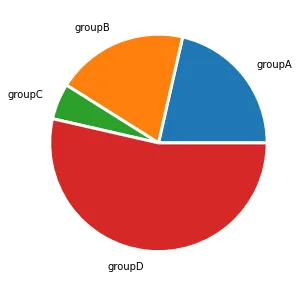
## Same chart as above but with specific wedgeprops option:
plt.pie(values, labels=names, labeldistance=1.15, wedgeprops = { 'linewidth' : 3, 'edgecolor' : 'white' });
Customize colors
You can change the color palette in use thanks to the color parameter that expects an array of color.
See the dedicated section of the gallery for more tips on color with matplotlib.
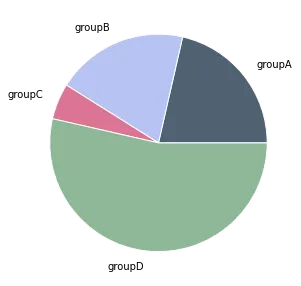
# Create a set of colors
colors = ['#4F6272', '#B7C3F3', '#DD7596', '#8EB897']

# Use it thanks to the color argument
plt.pie(values, labels=names, labeldistance=1.15, wedgeprops = { 'linewidth' : 1, 'edgecolor' : 'white' }, colors=colors);