GV

GeezerVison

The World Wide Web, restored to 800 pixels of glory.

Home|About|Gaming cabinet|Archives|How it works|Starter sites

On this site

  • Python Tutorial
  • Data Types
  • Interview Questions
  • Examples
  • Quizzes
  • DSA Python
  • Data Science
  • NumPy
  • Pandas
  • Practice
  • Django
  • Flask
  • Introduction1 min read
  • Input & Output2 min read

This view

  • Original page
  • New address

GeezerVison is showing www.geeksforgeeks.org — Three-dimensional Plotting in Python using Matplotlib - GeeksforGeeks

geeksforgeeks
search icon
  • Courses
  • Tutorials
  • Interview Prep
  • Python Tutorial
  • Data Types
  • Interview Questions
  • Examples
  • Quizzes
  • DSA Python
  • Data Science
  • NumPy
  • Pandas
  • Practice
  • Django
  • Flask

Three-dimensional Plotting in Python using Matplotlib

Last Updated : 15 Jul, 2025

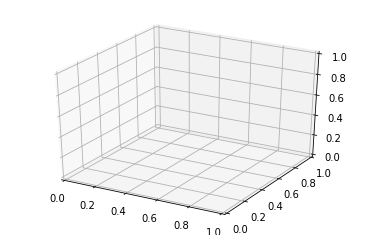
Visualizing data involving three variables often requires three-dimensional plotting to better understand complex relationships and patterns that two-dimensional plots cannot reveal. Python’s Matplotlib library, through its mpl_toolkits.mplot3d toolkit, provides powerful support for 3D visualizations. To begin creating 3D plots, the first essential step is to set up a 3D plotting environment by enabling 3D projection on the plot axes. For example:

Python
import matplotlib.pyplot as plt

fig = plt.figure()
ax = plt.axes(projection='3d')
plt.show()

Output

python-matplotlib-3d-1
Plotting 3D axes using matplotlib

Explanation:

  • plt.figure() creates a new figure object, which is a container for all the plot elements.
  • fig.add_subplot(111, projection='3d') adds a set of axes to the figure with 3D projection enabled. The 111 means "1 row, 1 column, first subplot".
  • plt.show() renders the plot window, displaying the 3D axes.

Example Of Three-dimensional Plotting using Matplotlib

1. 3d Line plot

A 3D line plot connects points in three-dimensional space to visualize a continuous path. It's useful for showing how a variable evolves over time or space in 3D. This example uses sine and cosine functions to draw a spiraling path.

Python
from mpl_toolkits import mplot3d
import numpy as np
import matplotlib.pyplot as plt

fig = plt.figure()
ax = plt.axes(projection='3d')

z = np.linspace(0, 1, 100)
x = z * np.sin(25 * z)
y = z * np.cos(25 * z)

ax.plot3D(x, y, z, 'green')
ax.set_title('3D Line Plot')
plt.show()

Output

Output
3D line plot graph using the matplotlib library

Explanation: We generate 100 points between 0 and 1 using np.linspace() for z, then compute x = z * np.sin(25z) and y = z * np.cos(25z) to form a spiral. The 3D spiral is plotted using ax.plot3D(x, y, z, 'green').

2. 3D Scatter plot

A 3D scatter plot displays individual data points in three dimensions, helpful for spotting trends or clusters. Each dot represents a point with (x, y, z) values and color can be used to add a fourth dimension.

Python
fig = plt.figure()
ax = plt.axes(projection='3d')

z = np.linspace(0, 1, 100)
x = z * np.sin(25 * z)
y = z * np.cos(25 * z)
c = x + y  # Color array based on x and y

ax.scatter(x, y, z, c=c)
ax.set_title('3D Scatter Plot')
plt.show()

Output

Output
3D point plot using Matplotlib library

Explanation: Using the same x, y and z values, ax.scatter() plots individual 3D points. Colors are set by c = x + y, adding a fourth dimension to visualize variation across points.

3. Surface Plot

Surface plots show a smooth surface that spans across a grid of (x, y) values and is shaped by z values. They’re great for visualizing functions with two variables, providing a clear topography of the data.

Python
x = np.outer(np.linspace(-2, 2, 10), np.ones(10))
y = x.copy().T
z = np.cos(x**2 + y**3)

fig = plt.figure()
ax = plt.axes(projection='3d')
ax.plot_surface(x, y, z, cmap='viridis', edgecolor='green')
ax.set_title('Surface Plot')
plt.show()

Output

Output
Surface plot using matplotlib library

Explanation: We create a grid with x and y using np.outer() and .T, then compute z = np.cos(x**2 + y**3). The surface is visualized with ax.plot_surface() using cmap='viridis' for color and edgecolor='green' for gridlines.

4. Wireframe Plot

A wireframe plot is like a surface plot but only shows the edges or "skeleton" of the surface. It’s useful for understanding the structure of a 3D surface without the distraction of color fill.

Python
def f(x, y):
    return np.sin(np.sqrt(x**2 + y**2))

x = np.linspace(-1, 5, 10)
y = np.linspace(-1, 5, 10)
X, Y = np.meshgrid(x, y)
Z = f(X, Y)

fig = plt.figure()
ax = plt.axes(projection='3d')
ax.plot_wireframe(X, Y, Z, color='green')
ax.set_title('Wireframe Plot')
plt.show()

Output

Output
3D wireframe graph using the matplotlib library

Explanation: We define f(x, y) = sin(√(x² + y²)), generate a meshgrid for x and y, and compute z values. Using ax.plot_wireframe(), we render the 3D surface as a green wireframe.

5. Contour plot in 3d

This plot combines a 3D surface with contour lines to highlight elevation or depth. It helps visualize the function’s shape and gradient changes more clearly in 3D space.

Python
def fun(x, y):
    return np.sin(np.sqrt(x**2 + y**2))

x = np.linspace(-10, 10, 40)
y = np.linspace(-10, 10, 40)
X, Y = np.meshgrid(x, y)
Z = fun(X, Y)

fig = plt.figure(figsize=(10, 8))
ax = plt.axes(projection='3d')
ax.plot_surface(X, Y, Z, cmap='cool', alpha=0.8)

ax.set_title('3D Contour Plot')
ax.set_xlabel('x')
ax.set_ylabel('y')
ax.set_zlabel('z')

plt.show()

Output

Output
3D contour plot of a function using matplotlib 

Explanation: We define fun(x, y) = sin(√(x² + y²)) and generate a dense grid for x and y. The surface is plotted with ax.plot_surface() using alpha=0.8 for transparency and axis labels are added for clarity.

6. Surface Triangulation plot

This plot uses triangular meshes to build a 3D surface from scattered or grid data. It's ideal when the surface is irregular or when using non-rectangular grids.

Python
from matplotlib.tri import Triangulation

def f(x, y):
    return np.sin(np.sqrt(x**2 + y**2))

x = np.linspace(-6, 6, 30)
y = np.linspace(-6, 6, 30)
X, Y = np.meshgrid(x, y)
Z = f(X, Y)

tri = Triangulation(X.ravel(), Y.ravel())

fig = plt.figure(figsize=(10, 8))
ax = fig.add_subplot(111, projection='3d')
ax.plot_trisurf(tri, Z.ravel(), cmap='cool', edgecolor='none', alpha=0.8)

ax.set_title('Surface Triangulation Plot')
ax.set_xlabel('x')
ax.set_ylabel('y')
ax.set_zlabel('z')

plt.show()

Output

Output
3D contour plot of a function using matplotlib 

Explanation: After defining the function and generating x and y with np.meshgrid(), we flatten them using .ravel() and create a Triangulation object. The surface is plotted with ax.plot_trisurf() using a colormap and transparency.

7. Möbius Strip Plot

A Möbius strip is a one-sided surface with a twist—a famous concept in topology. This plot visualizes its 3D geometry, showing how math and art can blend beautifully.

Python
R = 2
u = np.linspace(0, 2*np.pi, 100)
v = np.linspace(-1, 1, 100)
u, v = np.meshgrid(u, v)

x = (R + v * np.cos(u / 2)) * np.cos(u)
y = (R + v * np.cos(u / 2)) * np.sin(u)
z = v * np.sin(u / 2)

fig = plt.figure()
ax = fig.add_subplot(111, projection='3d')

ax.plot_surface(x, y, z, alpha=0.5)

ax.set_xlabel('X')
ax.set_ylabel('Y')
ax.set_zlabel('Z')
ax.set_title('Möbius Strip')

ax.set_xlim([-3, 3])
ax.set_ylim([-3, 3])
ax.set_zlim([-3, 3])

plt.show()

Output

Output
Mobius strip plot using matplotlib library 

Explanation: We generate parameters u and v to span the circle and strip width, mesh them and compute x, y and z using parametric equations. The twisted strip is plotted with ax.plot_surface() using transparency and custom axis limits.

Comment

Explore

    Python Fundamentals
    • Introduction1 min read
    • Input & Output2 min read
    • Variables4 min read
    • Operators4 min read
    • Keywords2 min read
    • Data Types4 min read
    • Conditional Statements3 min read
    • Loops3 min read
    • Functions4 min read
    Python Data Structures
    • String4 min read
    • List3 min read
    • Tuples3 min read
    • Dictionary3 min read
    • Set2 min read
    • Arrays5 min read
    Advanced Python
    • OOP Concepts3 min read
    • Exception Handling5 min read
    • File Handling4 min read
    • Python Database2 min read
    • MongoDB3 min read
    • MySQL7 min read
    • Packages4 min read
    • Modules3 min read
    • DSA Libraries5 min read
    • Python GUI2 min read
    Data Science with Python
    • Numpy3 min read
    • Pandas4 min read
    • Matplotlib3 min read
    • Seaborn3 min read
    • StatsModel2 min read
    • Model Building6 min read
    • TensorFlow2 min read
    • PyTorch5 min read
    Web Development with Python
    • Flask3 min read
    • Django5 min read
    • Django ORM4 min read
    • Jinja2 Templating5 min read
    • Django Templates5 min read
    • REST API3 min read
    • Build API with DRF4 min read
    Python Practice
    • Quiz1 min read
    • Practice Problems2 min read
    • Interview Q & A15+ min read
    Courses
    • Placement 360 Course2 min read
    • Data Science 360 Course2 min read
    • AI Engg Course2 min read
You are visitor 01402503 — GeezerVison does not store the pages you look up.
Best viewed with Netscape Navigator 4.7 or Internet Explorer 6 at 800×600. No cookies required.