GeezerVisonThe World Wide Web, restored to 800 pixels of glory. |
| Home|About|Gaming cabinet|Archives|How it works|Starter sites |
GeezerVison is showing www.tutorialspoint.com — JavaScript - Debugging 
Selected Reading
JavaScript - DebuggingWhat is Debugging?Debugging in JavaScript is a process of examining JavaScript code and finding erros and fixing them. Every now and then, developers commit mistakes while coding. This error can be logical, syntax, or runtime errors. An error in a program or a script is referred to as a bug. The process of finding and fixing bugs is called debugging and is a normal part of the development process. This section covers tools and techniques that can help you with debugging tasks. Let's look at the different methods of debugging. Use a JavaScript DebuggerA debugger is an application that places all aspects of script execution under the control of the programmer. Debuggers provide fine-grained control over the state of the script through an interface that allows you to examine and set values as well as control the flow of execution. Once a script has been loaded into a debugger, it can be run one line at a time or instructed to halt at certain breakpoints. Once execution is halted, the programmer can examine the state of the script and its variables in order to determine if something is amiss. You can also watch variables for changes in their values. Nowadays, all modern browser comes with built-in debuggers. You can use the console of the browser to debug the JavaScript code. How to Open Console in the Browser?In this section, you will learn to open the console in different browsers. Open Console in ChromePress the Below keys.
OR
Open Console in FirefoxPress the Below keys.
OR
Open Console in Microsoft EdgePress the Below keys.
OR
Open Console in SafariPress the Below keys.
OR
Open Console in OperaPress the Below keys.
OR
Using the console.log() methodThe console.log() method prints the message in the web browser's console. It can print primitive values, objects, variable values, etc. You can print the variable's value in the console you want to debug. SyntaxUsers can follow the syntax below to use the console.log() method. Console.log(val1, val2, ...); The console.log() method takes the comma-separated arguments to print in the web browser's console. ExampleIn the code below, we add the value of the num1 and num2 variables. In the browser, you can see that the sum is 32 rather than 5. So, you are required to debug the code. When you print the type of the num1 and num2 into the console, it shows that the type of the num1 is a string. So, it converts the value of the num2 variable into the string and appends it with the value of the num1. <html>
<body>
<div id = "output"> </div>
<p>Note: To see the resullt in console, please open it before you run the code.</p>
<script>
let num1 = "3";
let num2 = 2;
let sum = num1 + num2;
document.getElementById("output").innerHTML = "The sum is: " + sum;
console.log("typeof num1 is " + typeof num1);
console.log("typeof num2 is " + typeof num2);
</script>
</body>
</html>
OutputThe sum is: 32 Note: To see the resullt in console, please open it before you run the code. It will produce the following result in the web console − typeof num1 is string VM75616:7 typeof num2 is number ExampleIn the code below, we have a person object containing various properties. We print the firstname and lastname properties of the person object in the web browser. It prints undefined. To find the error, you are required to debug the code. Next, we print the object in the console and found that the Person object doesn't contain the firstname and lastname properties; instead of that, it contains the 'name' property. <html>
<body>
<div id = "demo"> </div>
<p>Note: To see the resullt in console, please open it before you run the code.</p>
<script>
let output = document.getElementById("demo");
let person = {
name: "John",
age: 25,
city: "New York"
}
output.innerHTML = "The name of the person is: " + person.name + "<br>";
output.innerHTML += "The city of the person is: " + person.city + "<br>";
console.log(person);
</script>
</body>
</html>
OutputThe name of the person is: John The city of the person is: New York Note: To see the resullt in console, please open it before you run the code. It will produce the following result in the web console − {name: 'John', age: 25, city: 'New York'}
Using the debugger KeywordYou can go to your browser's console's 'source' panel to debug the code. The 'debugger' keyword allows you to force-stop the execution of the JavaScript code. Stopping the execution of the JavaScript code allows you to debug the code line-by-line. Once you find the bug or everything looks fine, you can resume the execution of the JavaScript code. You can open the console and run the below code in the browser. It will automatically pause the code, and you can observe the values of the variables to debug the code. ExampleThe below example is the same as above. We have added the 'debugger' keyword before it prints the values of the object properties. It will pause the execution of the code before printing the values of properties. After that, when you click on the resume button, it will resume the execution of the code. <html>
<body>
<div id = "demo"> </div>
<script>
const output = document.getElementById("demo");
const person = {
name: "John",
age: 25,
city: "New York"
}
debugger;
output.innerHTML = "The name of the person is: " + person.name + "<br>";
output.innerHTML += "The city of the person is: " + person.city;
</script>
</body>
</html>
OutputThe name of the person is: John The city of the person is: New York You will see the result in console similar to the below screenshot. To see the resullt in console, please open it before you run the code. 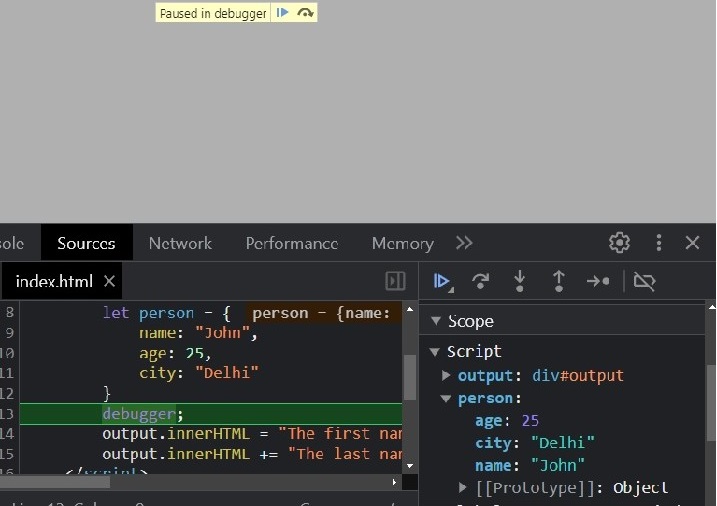
The above image shows the pause button at the top of the browser window and the object or variables in the bottom-right corner. This way, you can check variable values and debug the code to fix the bugs. Setting Break Points in the Browser's DebuggerSetting up breakpoints is the same as using the 'debugger' keyword to debug the JavaScript code. So, this is an alternative way. In the 'source' panel, you can click on the line number where you want to add a breakpoint, as shown in the image below. After that, when you execute the JavaScript code, it will stop the execution of the code, and you can observe the variable values on the right side. 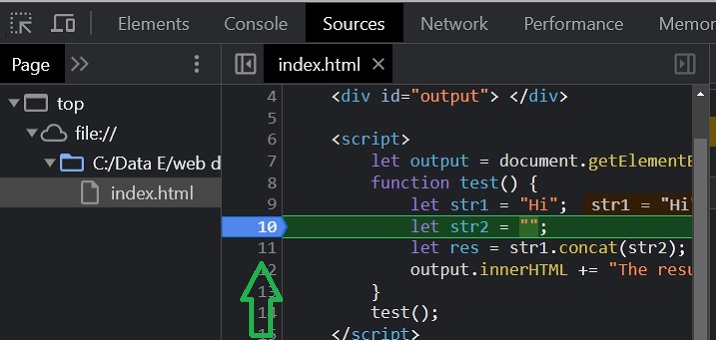
ExampleWe have defined the test() function in the example code below. The test() function concatenates the str1 and str2 strings. We have opened the 'source' panel in the browser in the developer tool. After that, we have added the breakpoint on the line 'let res = str1.concat(str2);'. So, the debugger will stop the execution of the code at this line, and you can click the resume button to resume the execution of the code. <html>
<body>
<div id = "output">The resultant string after appending str2 to str1 is: </div>
<script>
function test() {
let str1 = "Hi";
let str2 = "";
let res = str1.concat(str2);
document.getElementById("output").innerHTML += res;
}
test();
</script>
</body>
</html>
OutputThe resultant string after appending str2 to str1 is: Hi You will see the result in console similar to the below screenshot. To see the resullt in console, please open it before you run the code. 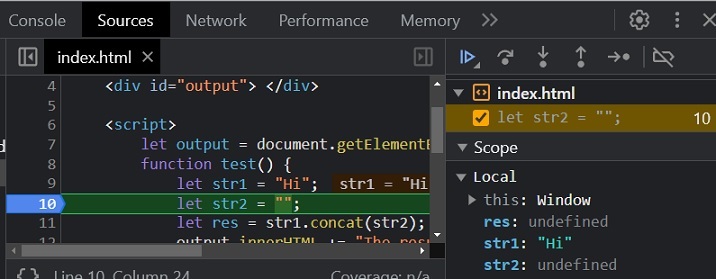
Useful Tips for DevelopersYou can keep the following tips in mind to reduce the number of errors in your scripts and simplify the debugging process −

Advertisements
|
| You are visitor 01402520 — GeezerVison does not store the pages you look up. Best viewed with Netscape Navigator 4.7 or Internet Explorer 6 at 800×600. No cookies required. |