GV

GeezerVison

The World Wide Web, restored to 800 pixels of glory.

Home|About|Gaming cabinet|Archives|How it works|Starter sites

On this site

  • All
  • Best
  • Libs
  • Learn

This view

  • Original page
  • New address

GeezerVison is showing python-graph-gallery.com — Basic Matplotlib Scatterplot

Basic Matplotlib Scatterplot

logo of a chart:ScatterPlot

This post describes how to draw a basic scatterplot using matplotlib library. Once you understood the function, you can see the next post to customise your scatterplot chart.

Scatterplot sectionAbout this chart

Libraries & Dataset

Let's start by loading the necessary libraries and create a dataset

  • matplotlib: for displaying the plot
  • pandas: for data manipulation
  • numpy: for data generation
# libraries
import matplotlib.pyplot as plt
import numpy as np
import pandas as pd

# Create a dataset:
df = pd.DataFrame({
    'x_values': range(1, 101),
    'y_values': np.random.randn(100)*15+range(1, 101)
})
df.head()
x_valuesy_values
0116.036968
12-11.666240
238.503309
347.816552
45-0.893881
Dataviz caveat card: Beware of overplotting

⚠️ Avoid the 61 most common dataviz mistakes

The dataviz caveats I see the most, as a deck of 61 cards: a chart that is not ideal, and a better alternative. Free.

I respect your privacy. Unsubscribe anytime.

Most simple scatter plot

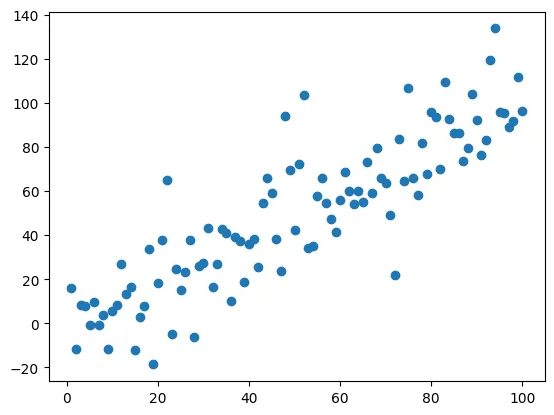
This is a basic scatterplot example made with the scatter() function of Matplotlib. These arguments are passed to the function:

  • x : column name to be used for the x axis
  • y : column name to be used for the y axis
  • data : the dataset to be used
  • linestyle : style of the lines between each point
  • marker : marker style of the points

Basic Matplotlib Scatterplot: Most simple scatter plot

fig, ax = plt.subplots()
ax.scatter(
    'x_values', 'y_values',
    data=df,
    marker='o'
)
plt.show()

Going further

This post explains how to create a scatter plot with Matplotlib.

You might be interested in how to custom markers in scatter plots and how to link title and markers in scatter plots.

Related posts

Selecting Color Palettes with Seaborn

Selecting Color Palettes with Seaborn

Custom a Matplotlib Scatterplot

Custom a Matplotlib Scatterplot

Use categorical variable to color scatterplot in seaborn

Use categorical variable to color scatterplot in seaborn

Control Axis Limits of Plot

Control Axis Limits of Plot

Control Color of Each Marker

Control Color of Each Marker

Add text annotation on scatterplot

Add text annotation on scatterplot

Related chart types

logo of a chart:ScatterPlot

Scatterplot

logo of a chart:Heatmap

Heatmap

logo of a chart:Correlogram

Correlogram

logo of a chart:BubblePlot

Bubble

logo of a chart:ScatterConnected

Connected Scatter

logo of a chart:2dDensity

2D Density

300 projects

💡 Out of dataviz inspiration?

I have spent years collecting the most beautiful data visualizations out there. Get the list of my top 300 dataviz projects, hand-picked, for free.

I respect your privacy. Unsubscribe anytime.

You are visitor 01402503 — GeezerVison does not store the pages you look up.
Best viewed with Netscape Navigator 4.7 or Internet Explorer 6 at 800×600. No cookies required.