GV

GeezerVison

The World Wide Web, restored to 800 pixels of glory.

Home|About|Gaming cabinet|Archives|How it works|Starter sites

On this site

  • All
  • Best
  • Libs
  • Learn

This view

  • Original page
  • New address

GeezerVison is showing python-graph-gallery.com — Scatterplot

Scatterplot

logo of a chart:ScatterPlot

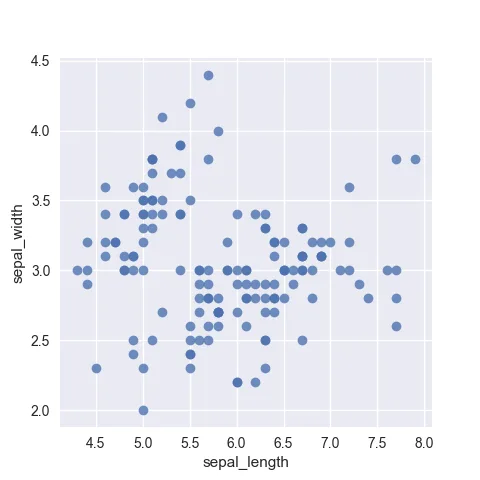
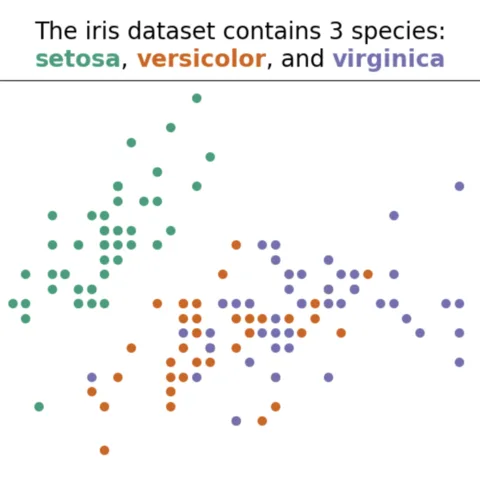
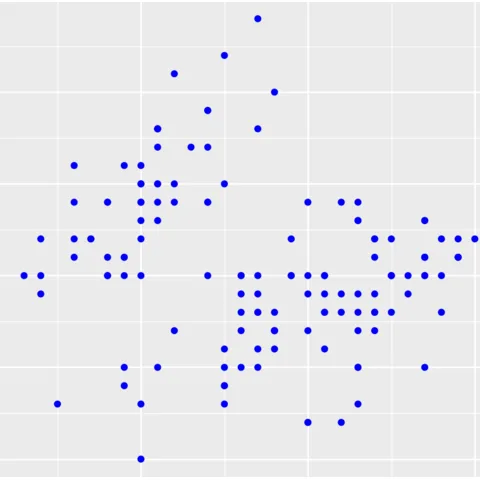
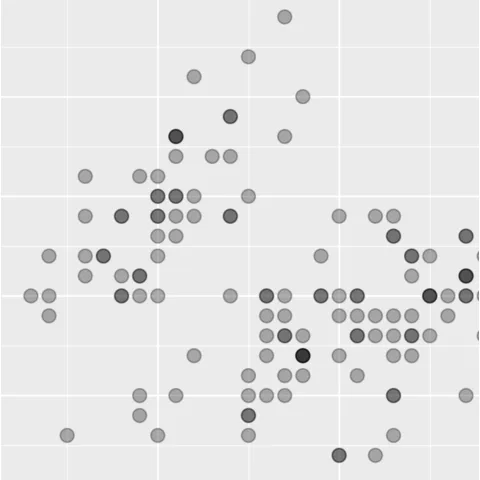
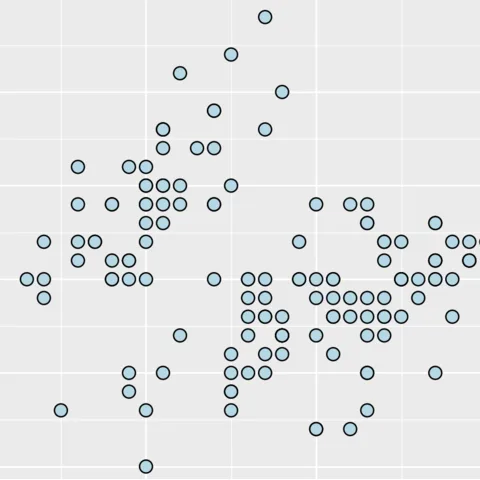
A scatter plot displays the relationship between 2 numeric variables, one being displayed on the X axis (horizontal) and the other on the Y axis (vertical). Each data point is represented as a circle.

Several tools allow to build scatterplots in python. Seaborn is probably the most straightforward library for the job, but matplotlib allows a greater level of customization. If you are looking for an interactive chart, plotly is definitely the way to go.

This page provides many examples of scatterplots made with those Python tools, going from simple examples to highly customized versions.

Scatterplot sectionAbout this chart

⏱ Quick start (Seaborn)

The scatterplot() function of the Seaborn library is definitely the best way to build a scatterplot in seconds. 🔥

Simply pass a numeric column of a data frame to both the x and y variable and the function will handle the rest.

Basic boxplot with Python and Seaborn from various data input formats.

Basic boxplot with Python and Seaborn from various data input formats.

# library & dataset
import seaborn as sns
df = sns.load_dataset('iris')

# use the function scatterplot() to make a scatterplot
sns.scatterplot(x=df["sepal_length"], y=df["sepal_width"])

⚠️ Scatterplot and overplotting

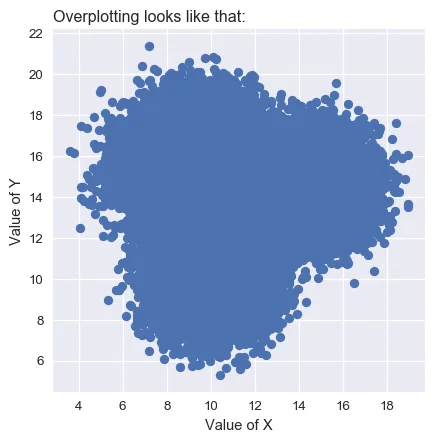
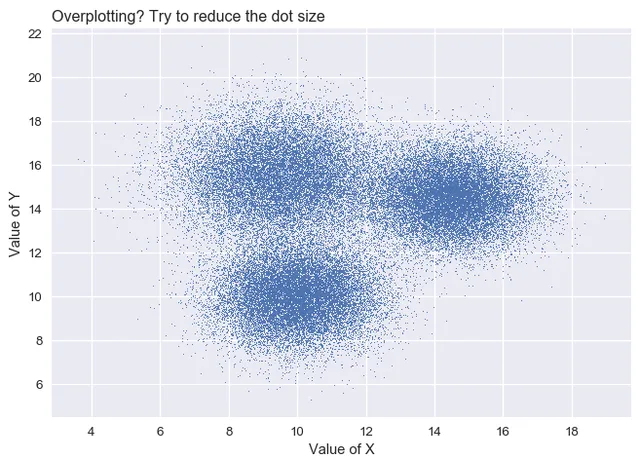
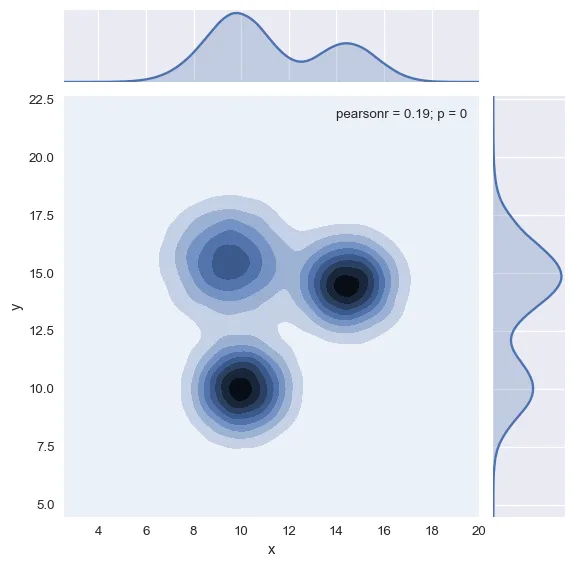
The main danger with scatterplots is overplotting. When the sample size gets big, circles tend to overlap, making the figure unreadable.

Several workarounds exist to fix the issue, like using opacity or switching to another chart type:

Basic boxplot. You can quickly read the median, quartiles and outliers of each group.

Basic boxplot. You can quickly read the median, quartiles and outliers of each group.

If you add individual points with jitter, a bimodal distribution appears for group B

If you add individual points with jitter, a bimodal distribution appears for group B

If you have a very large dataset, the violin plot is a better alternative than jittering

If you have a very large dataset, the violin plot is a better alternative than jittering

Code and more

Seaborn logoScatterplots with Seaborn

Seaborn is a python library allowing to make better charts easily. The regplot() function should get you started in minutes. The first example below explains how to build the most basic scatterplot with python. Then, several types of customization are described: adding a regression line, tweaking markers and axis, adding labels and more.

Most basic scatterplot with seaborn

Most basic scatterplot with seaborn

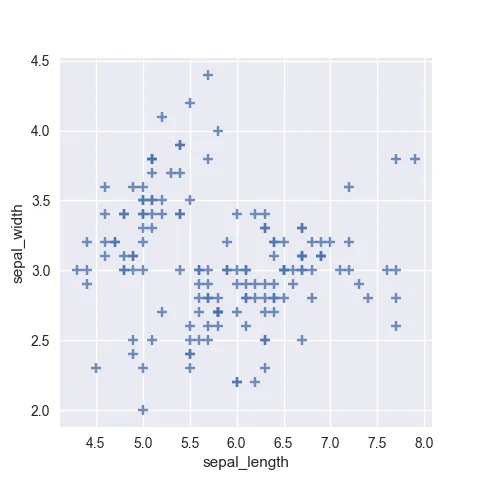
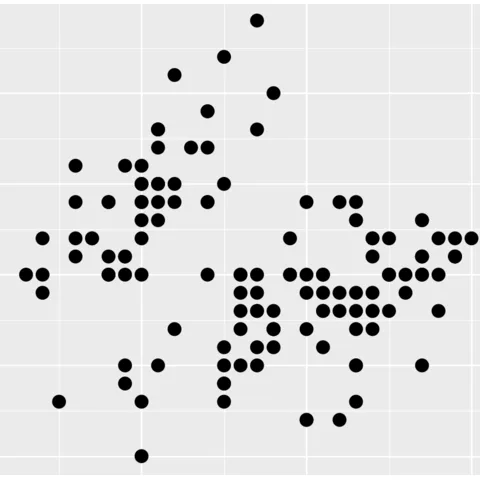
Customize markers: color, size, opacity, type and more

Customize markers: color, size, opacity, type and more

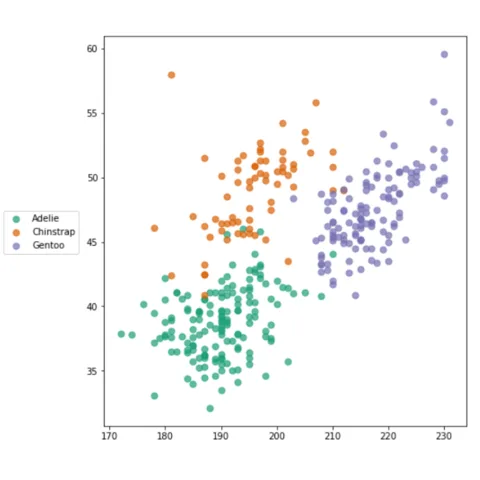
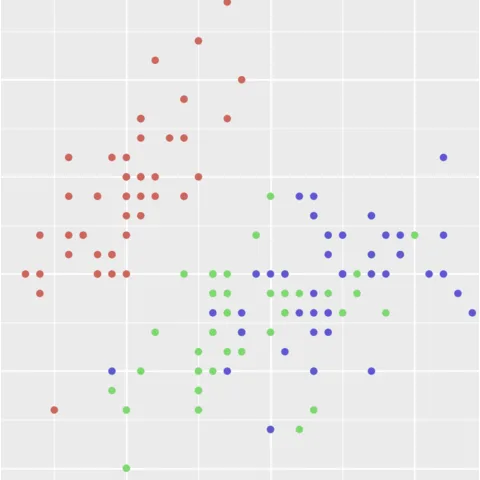
Color dots according to a group

Color dots according to a group

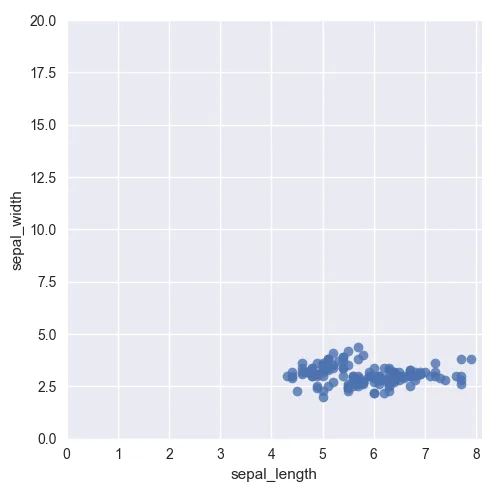
Control X and Y axes limits

Control X and Y axes limits

Control the marker's color according to their coordinates

Control the marker's color according to their coordinates

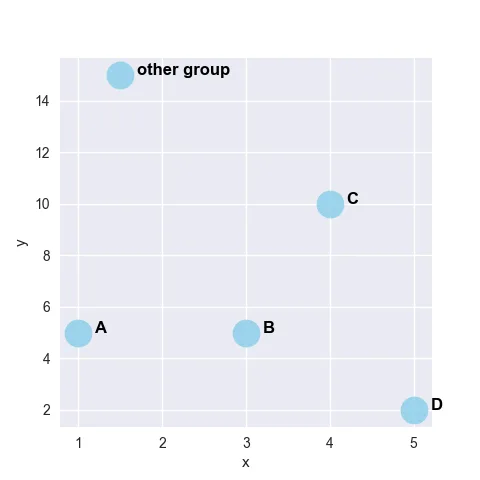
Add labels manually on your scatterplot

Add labels manually on your scatterplot

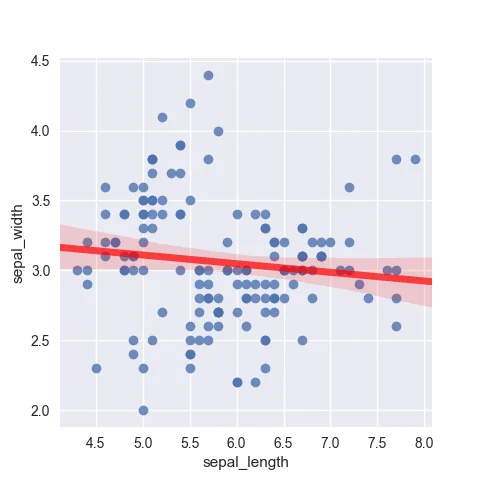
A nice way to add info and highlight trend in a scatter plot is to add a regression line on top of the dots. Thanks to its regplot() and lmplot() function, it's quite easy!

The main difference between those 2 functions are that:

  • regplot() is used for simple scatter plot with a trend line
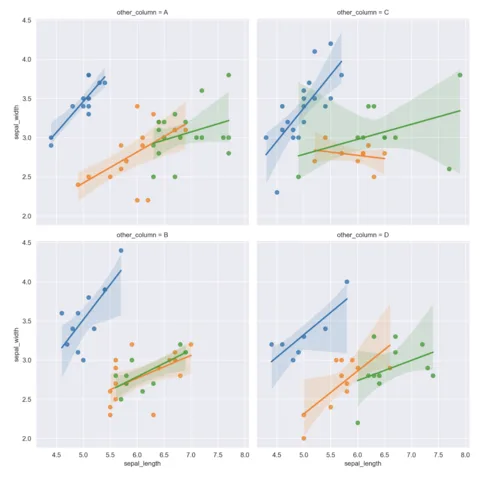
  • lmplot() can also be used for facetting: e.g creating multiple scatter plots
Add a regression thanks to the fit_reg parameter

Add a regression thanks to the fit_reg parameter

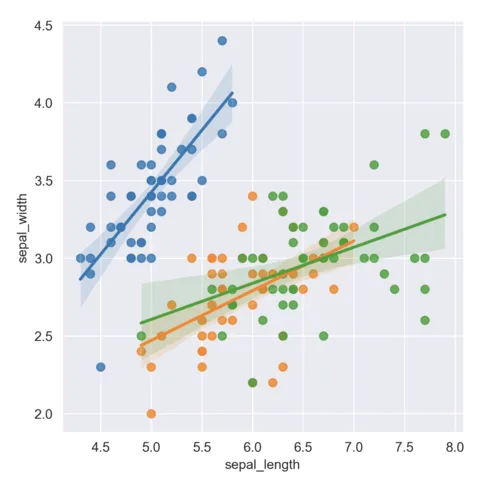
Split scatter plot by a category

Split scatter plot by a category

Faceted scatter plot with regression line

Faceted scatter plot with regression line

🔎 scatterplot() function parameters → see full doc

→ Description

The scatterplot() function of seaborn creates a scatter plot to visualize the relationship between two continuous variables. It displays each observation as a point on a two-dimensional plane.

→ Arguments

Description

Dataframe-like (pandas, numpy, polars...) with the columns we want to plot.

Possible values → dataframe

It just has to be a pandas.DataFrame (columns are variables), numpy.ndarray (rows/columns are variables), or any mapping/sequence (dictionaries/lists)

Supports both long-form (each variable in its own column) and wide-form (variables in separate columns; reshaped internally).

Code Example

# Library & Dataset
import seaborn as sns
df = sns.load_dataset('iris')

# Plot
sns.scatterplot(
  data=df,
  x='sepal_length',
  y='sepal_width'
)
plt.show()
More about the scatterplot() function.

More about the scatterplot() function.

💡 Other charts involving scatterplots and Seaborn

If you are interested in scatterplots, some other chart could be useful to you.

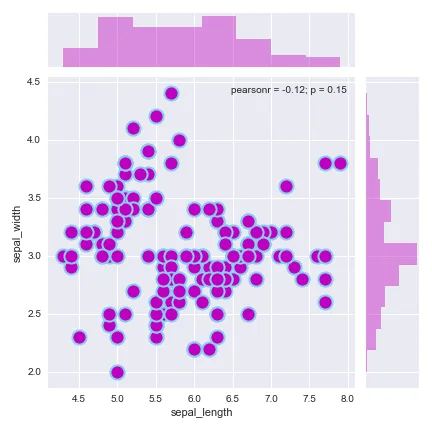
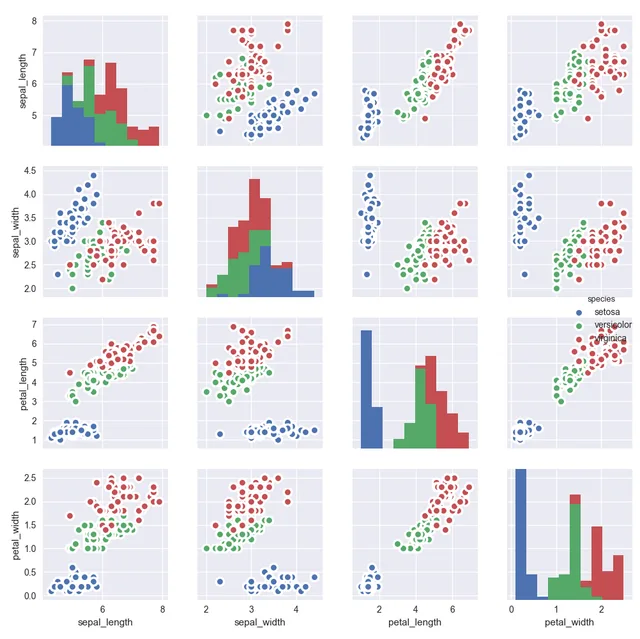
A scatterplot with marginal distribution allows to check the distribution of both the x and y variables. A correlogram allows to check the relationship between each pair of numeric variables in a dataset.

Scatterplot with marginal distributions

Scatterplot with marginal distributions

Build a correlogram with the pairplot function

Build a correlogram with the pairplot function

⏱ Quick start (Matplotlib)

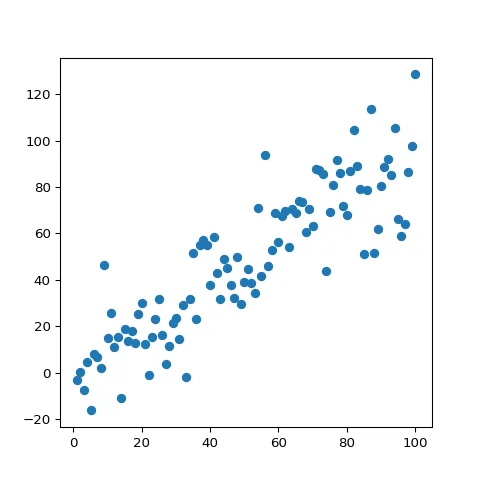
Matplotlib also requires only a few lines of code to draw a scatterplot thanks to its plot() function. The resulting chart is not as good-looking, but the function probably offers more flexibility in term of customization.

Most basic scatterplot with Matplotlib.

Most basic scatterplot with Matplotlib.

# libraries
import matplotlib.pyplot as plt
import numpy as np
import pandas as pd

# Create a dataset:
df=pd.DataFrame({'x_values': range(1,101), 'y_values': np.random.randn(100)*15+range(1,101) })

# plot
plt.plot( 'x_values', 'y_values', data=df, linestyle='none', marker='o')
plt.show()

⚠️ Avoid the 61 most common dataviz mistakes

Boxplots hiding information, pie charts, cut axes, spaghetti charts... I gathered the 61 dataviz caveats I see the most as a deck of cards. Each card shows a chart that is not ideal, and a better alternative.

Get the full deck for free:

I respect your privacy. Unsubscribe anytime.

Dataviz caveat card: Beware of overplotting
61
cards

Matplotlib logoScatterplots with Matplotlib

Matplotlib is another great alternative to build scatterplots with python. As often, it takes a bit more lines of code to get a decent chart, but allows more customization.

The examples below should get you covered for all the most common problems: adding markers, adding labels, changing shapes and more.

Most basic scatterplot with Matplotlib

Most basic scatterplot with Matplotlib

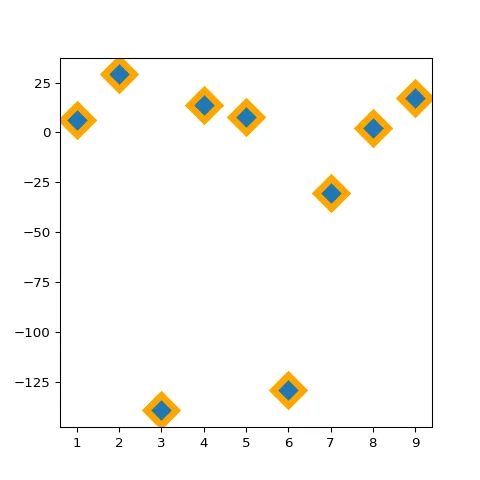
Customize marker features: size, color, stroke, type and more

Customize marker features: size, color, stroke, type and more

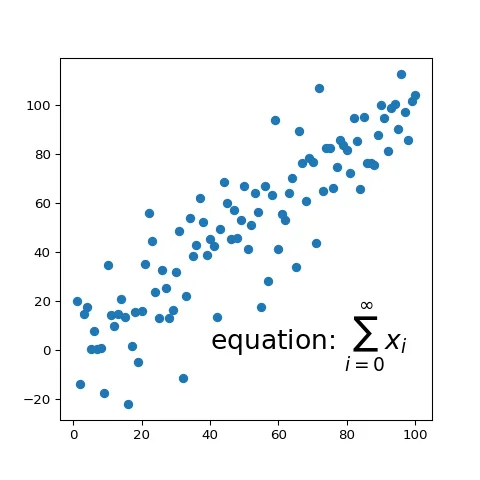
Display a math equation on your matplotlib chart

Display a math equation on your matplotlib chart

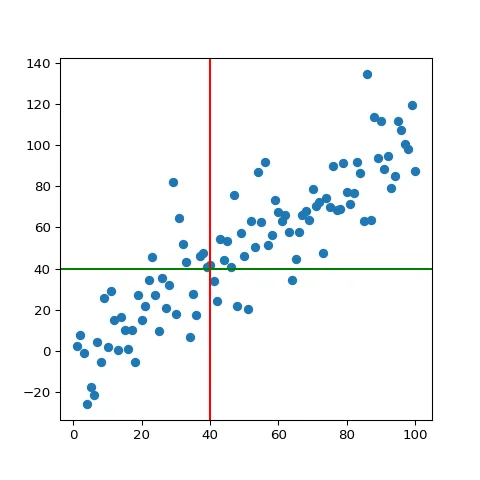
Matplotlib: add horizontal and vertical ablines

Matplotlib: add horizontal and vertical ablines

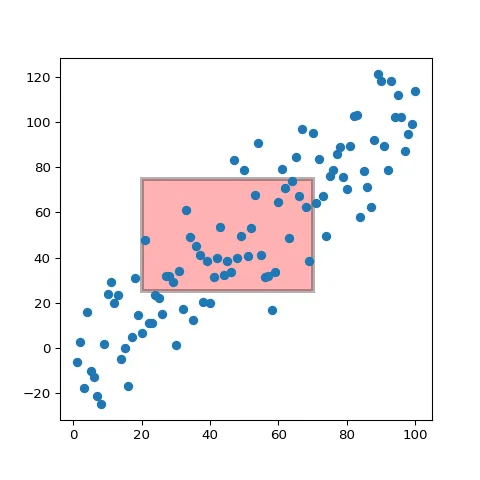
Highlight a specific area of the chart with Matplotlib

Highlight a specific area of the chart with Matplotlib

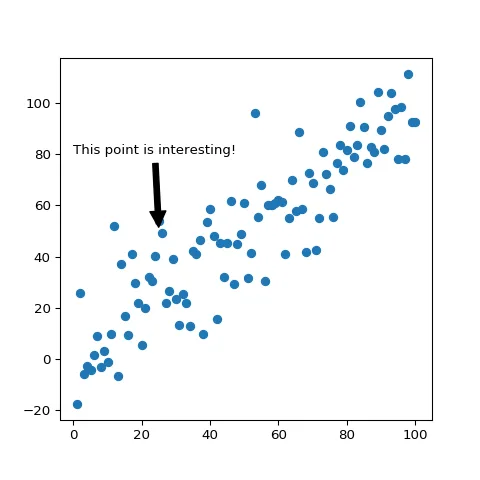
Add an annotation to highlight a specific marker

Add an annotation to highlight a specific marker

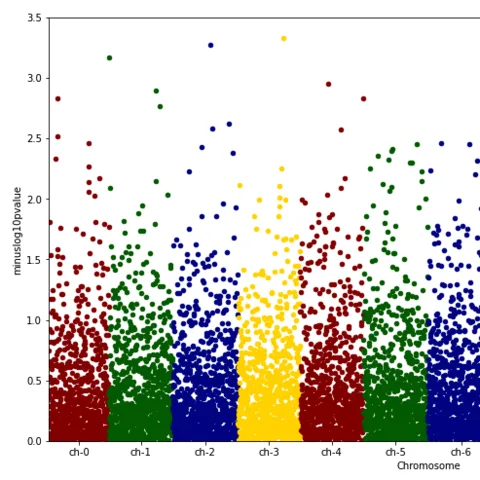
How to build a Manhattan plot with Python and Matplotlib

How to build a Manhattan plot with Python and Matplotlib

Scatterplot with grouping and legend

Scatterplot with grouping and legend

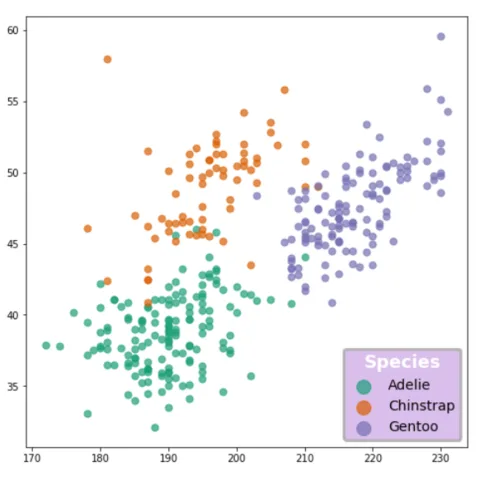
Legend customization: how to control location, add a background, customize labels and markers and more

Legend customization: how to control location, add a background, customize labels and markers and more

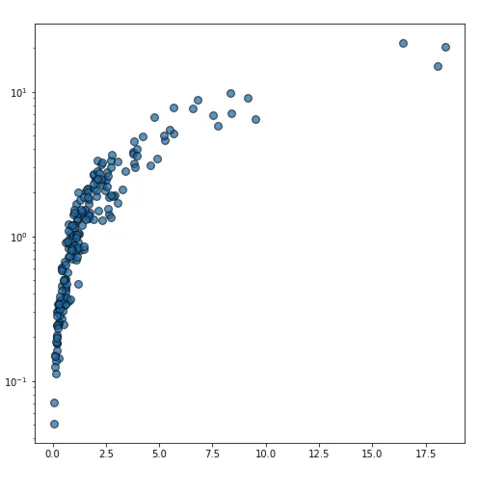
How to use a log scale for the X or the Y axis.

How to use a log scale for the X or the Y axis.

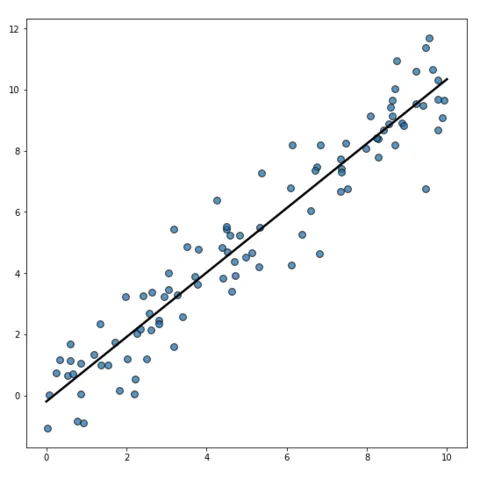
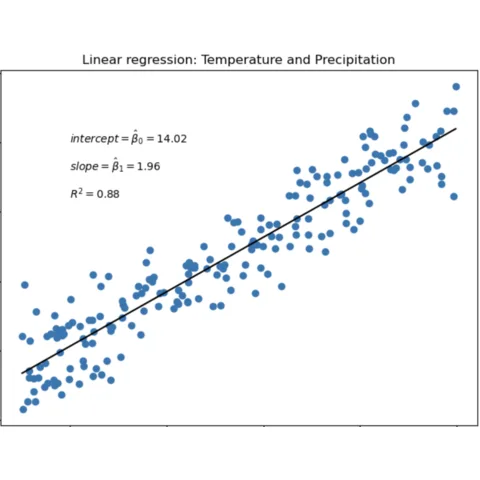
How to compute and add a linear regression to a scatterplot with Python and matplotlib

How to compute and add a linear regression to a scatterplot with Python and matplotlib

Linear regression with statistics on top of a scatterplot

Linear regression with statistics on top of a scatterplot

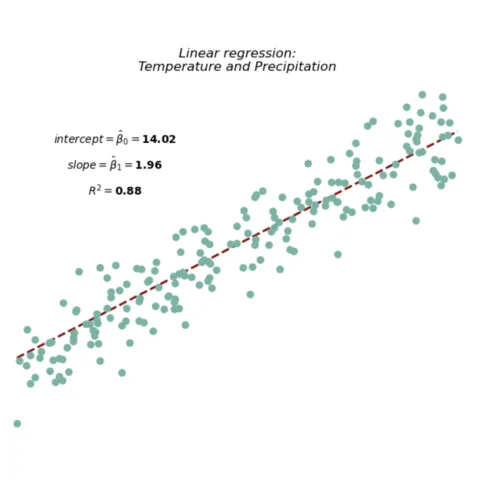
Customized linear regression with statistics on top of a scatterplot

Customized linear regression with statistics on top of a scatterplot

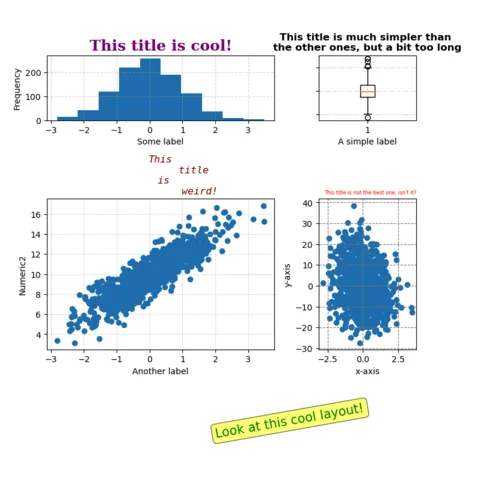
Subplot, title, and margin customization

Subplot, title, and margin customization

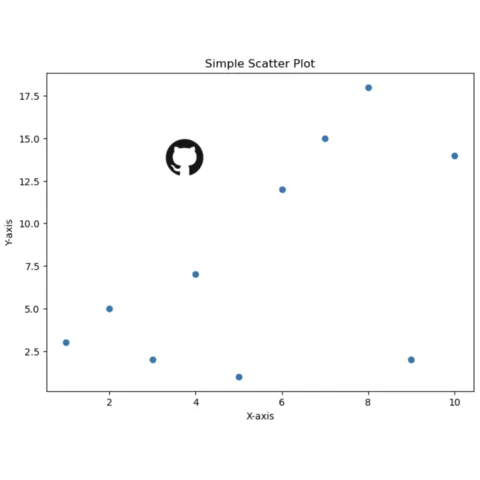
How to add an img into a matplotlib chart

How to add an img into a matplotlib chart

Link title and scatter plot with custom annotations

Link title and scatter plot with custom annotations

Plotly logoScatterplots with Plotly

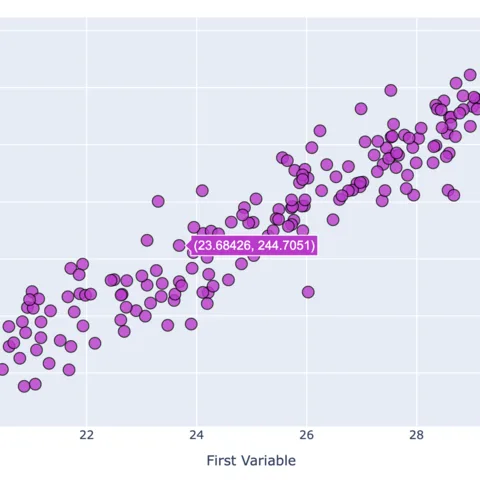
If you are looking for an interactive scatterplot, plotly is definitely the way to go. Try hovering over the graph below!

Interactivity is a real plus for scatterplots. It is very useful to have a tooltip associated to every markers to get some additional information about it. Zooming on a specific area of the scatterplot is also very valuable sometimes.

The examples below should help you get started quickly with the plotly API:

Most basic scatterplot with plotly

Most basic scatterplot with plotly

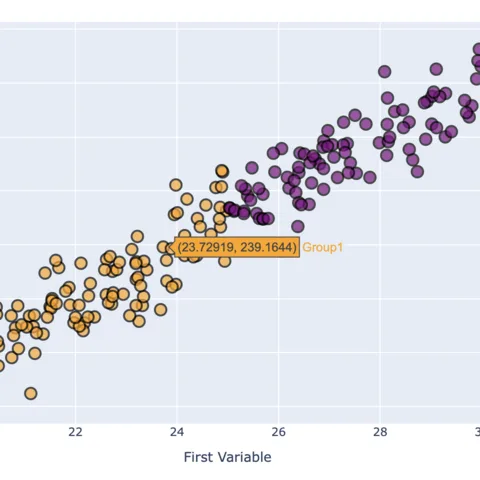
Plotly scatterplot with several levels of grouping

Plotly scatterplot with several levels of grouping

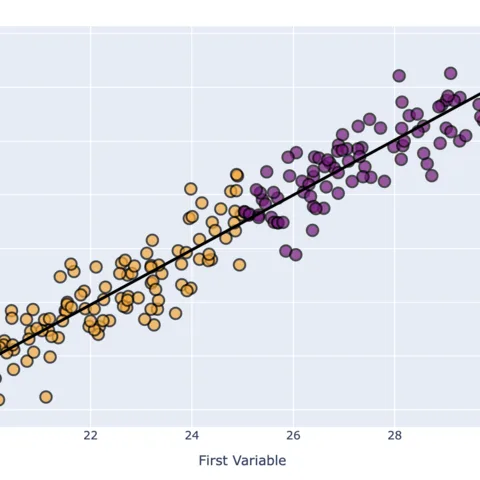
Plotly scatterplot with a trend line

Plotly scatterplot with a trend line

Pandas logoScatterplots with Pandas

Pandas, a data analysis library, also offers functions to build scatterplots. It uses matplotlib under the hood, but the syntax is more concise.

The main difference is that we have to work with Pandas objects such as Series and DataFrame.

The examples below should help you get started quickly with the pandas API:

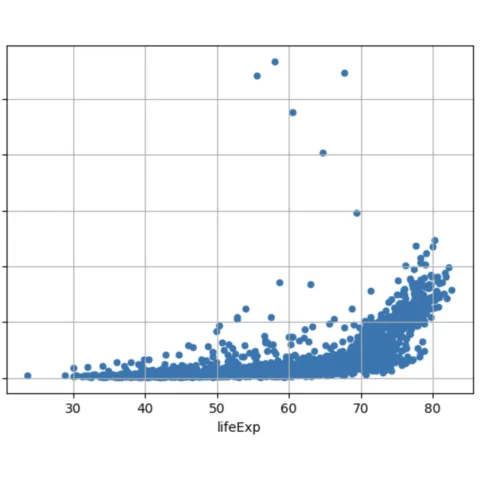
Introduction to scatter plot with pandas

Introduction to scatter plot with pandas

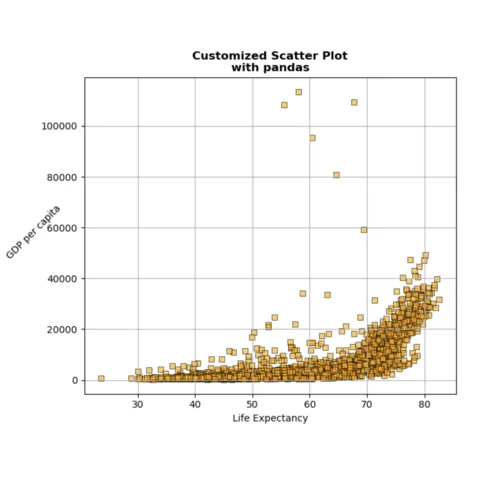
Customize scatter plots with pandas

Customize scatter plots with pandas

Scatter plots grouped by color with pandas

Scatter plots grouped by color with pandas

Plotnine logoScatterplots with Plotnine

Plotnine is a python library allowing to make charts using the grammar of graphics principles. The geom_point() function should get you started in minutes.

The examples below should help you get started quickly with the plotnine API:

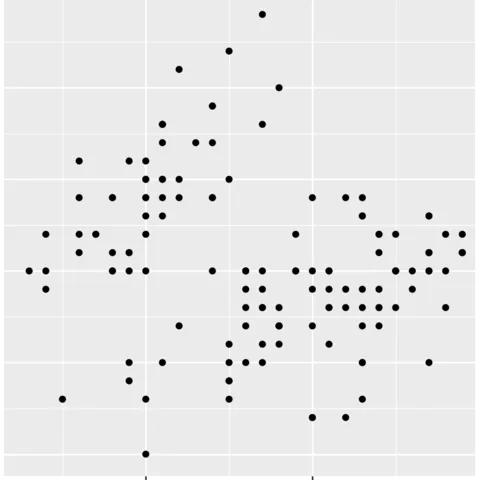
Most basic scatterplot with plotnine

Most basic scatterplot with plotnine

Change color markers

Change color markers

Color by group

Color by group

Change marker size

Change marker size

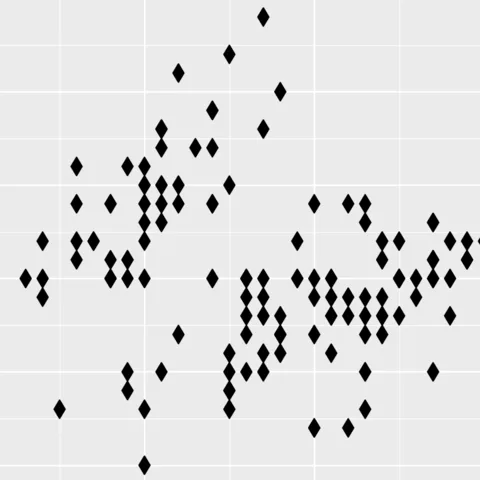
Changer marker shape

Changer marker shape

Changer marker transparency

Changer marker transparency

Custom edge colors

Custom edge colors

Matplotlib logoBest python scatterplot examples

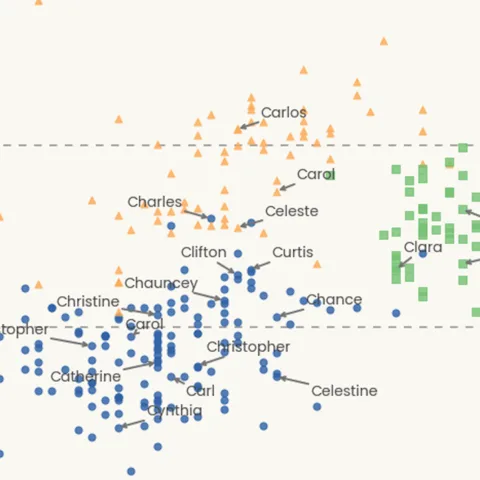
The web is full of astonishing charts made by awesome bloggers, (often using R). The Python graph gallery tries to display (or translate from R) some of the best creations and explain how their source code works.

The first example below demos how to add clean labels on a scatterplot, automatically avoiding overlapping. It also explains how to control background, fonts, titles and more.

If you want to display your work here, please drop me a word or even better, submit a Pull Request!

Learn how to use the adjustText library to add many labels with no overlaps.

Learn how to use the adjustText library to add many labels with no overlaps.

Scatterplot with regression fit, group colors and non-overlapping labels.

Scatterplot with regression fit, group colors and non-overlapping labels.

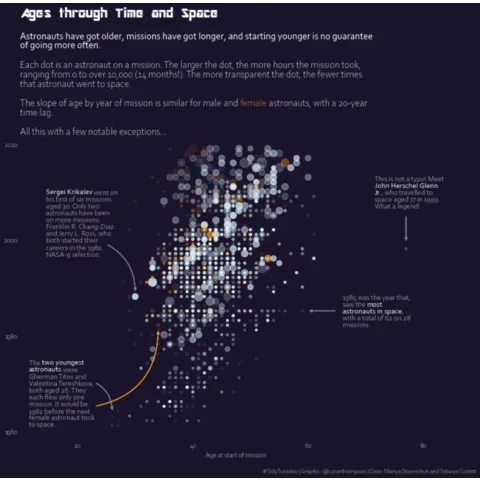
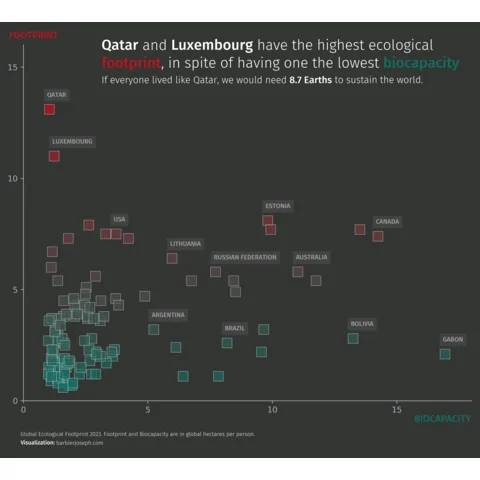
Dark mode scatterplot with custom annotations, title and explanations. All of that with a very good appearance!

Dark mode scatterplot with custom annotations, title and explanations. All of that with a very good appearance!

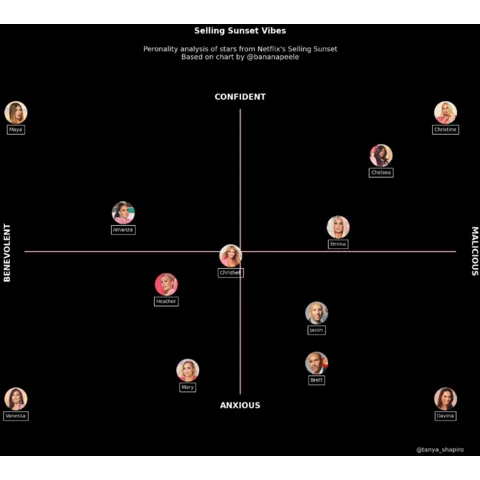
A scatter plot with images inside each marker to provide additional context

A scatter plot with images inside each marker to provide additional context

A scatter plot with custom annotations and colors, with some markers being circled

A scatter plot with custom annotations and colors, with some markers being circled

A scatter plot with custom annotations and specific highlights

A scatter plot with custom annotations and specific highlights

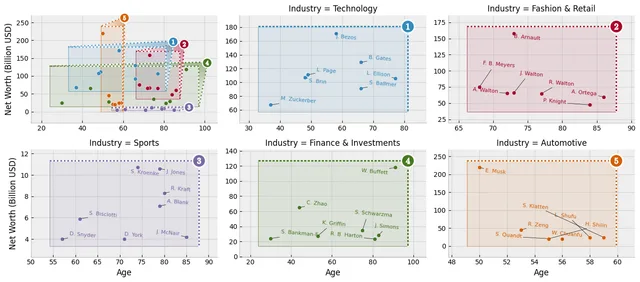
A lattice of scatter plots, with data excerpted by category from a main joint axes onto faceted zoom grids

A lattice of scatter plots, with data excerpted by category from a main joint axes onto faceted zoom grids

Related chart types

logo of a chart:ScatterPlot

Scatterplot

logo of a chart:Heatmap

Heatmap

logo of a chart:Correlogram

Correlogram

logo of a chart:BubblePlot

Bubble

logo of a chart:ScatterConnected

Connected Scatter

logo of a chart:2dDensity

2D Density

300 projects

💡 Out of dataviz inspiration?

I have spent years collecting the most beautiful data visualizations out there. Get the list of my top 300 dataviz projects, hand-picked, for free.

I respect your privacy. Unsubscribe anytime.

You are visitor 01402503 — GeezerVison does not store the pages you look up.
Best viewed with Netscape Navigator 4.7 or Internet Explorer 6 at 800×600. No cookies required.