GeezerVison is showing python-graph-gallery.com — 2d density chart
2D Density Chart
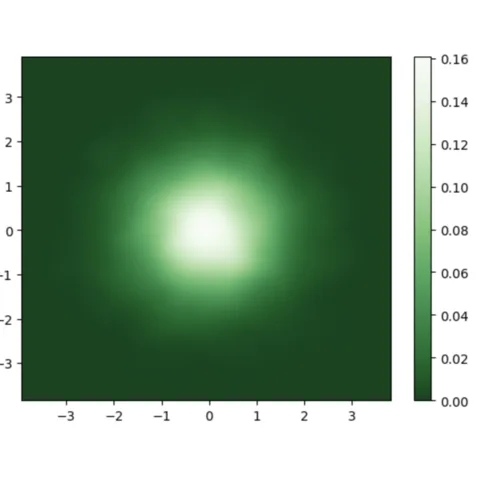
This section explains how to build a 2d density chart or a 2d histogram with python. Those chart types allow to visualize the combined distribution of two quantitative variables. They can be built with Matplotlib or Seaborn.
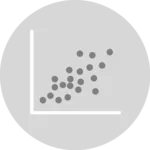
There are several chart types allowing to visualize the distribution of a combination of 2 numeric variables. They always have a variable represented on the X axis, the other on the Y axis, like for a scatterplot (left).
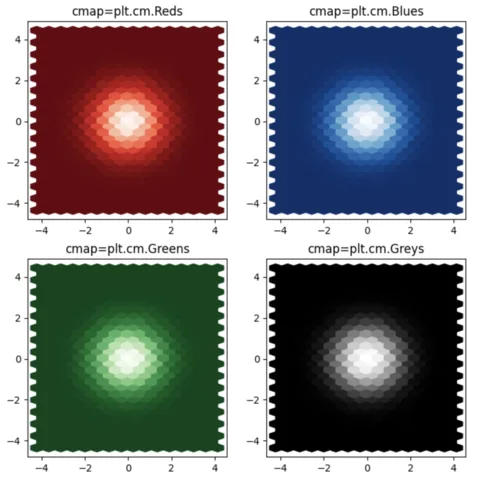
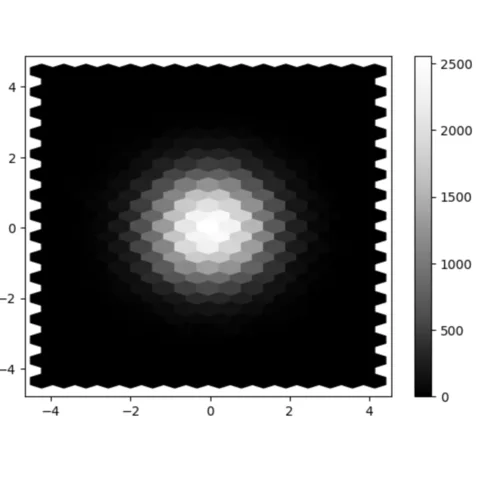
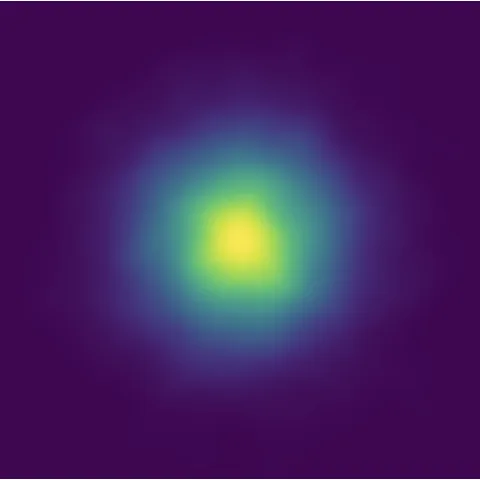
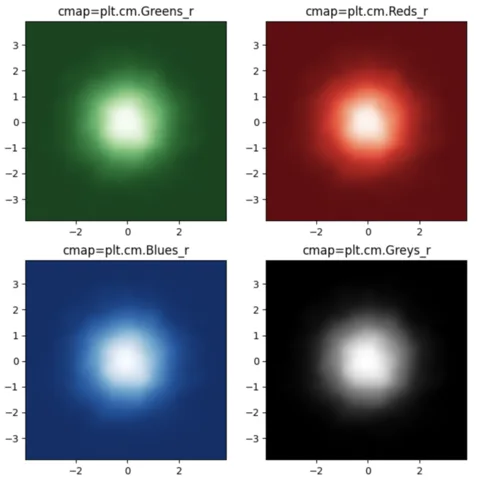
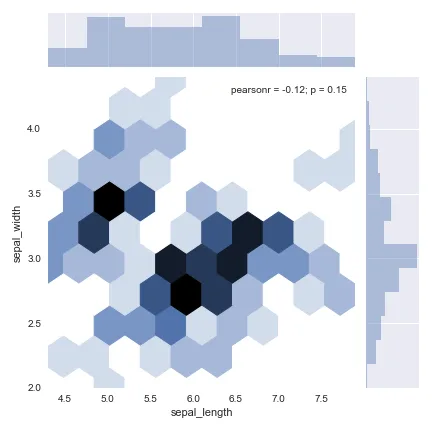
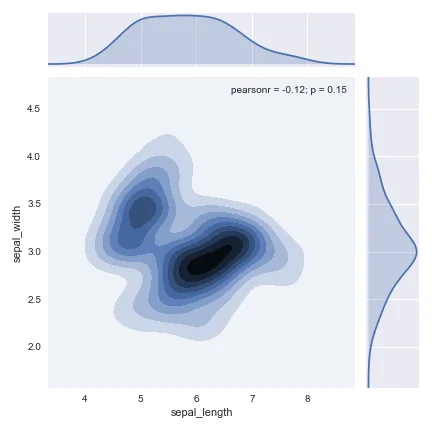
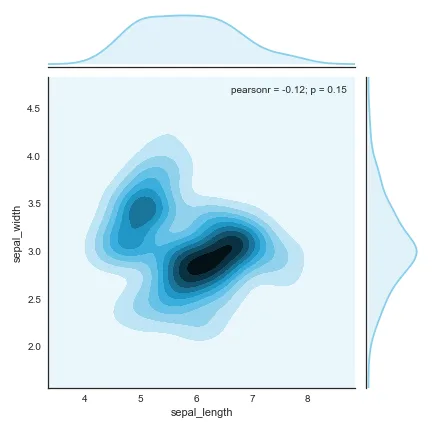
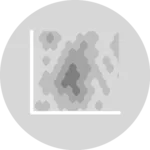
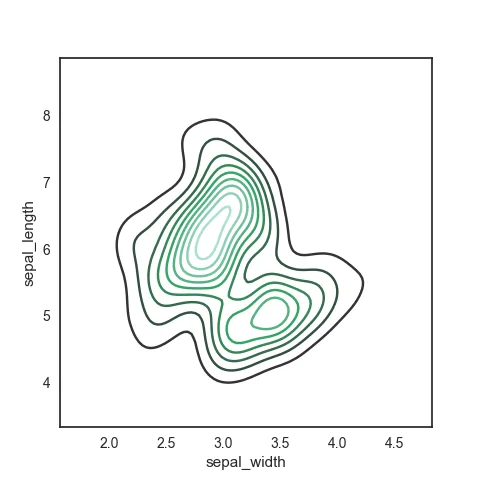
Then the number of observations within a particular area of the 2D space is counted and represented with a color gradient. The shape can vary: hexagones result in a hexbin chart, squares in a 2d histogram. A kernel density estimate can be used to get a 2d density plots or a contour plots
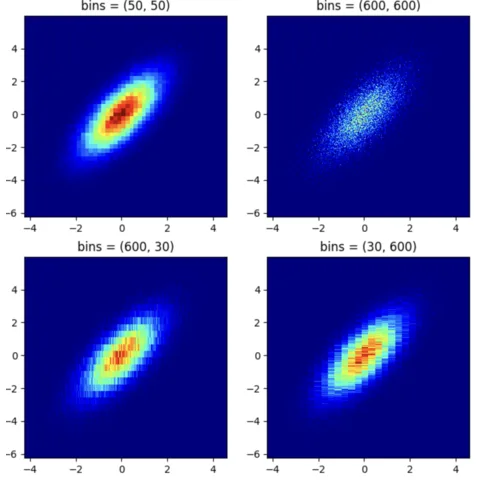
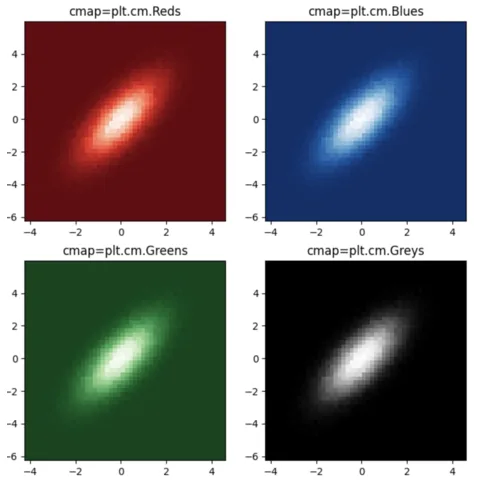
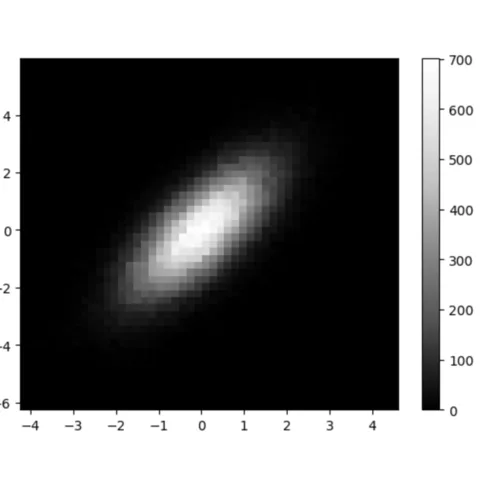
Build a 2d histogram thanks to the hist2d() function of the Matplotlib library. Do not forget to play with the bins argument to find the value representing the best your data.
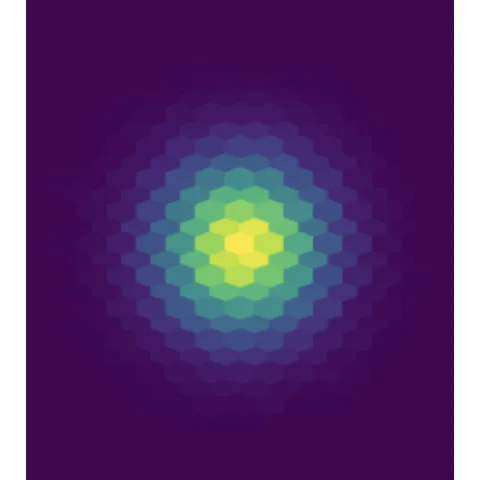
Split the graph area in hexagones and you get a hexbin density chart. This time, it is matplotlib that gets you covered thanks to its hexbin() function.
2D densities often combined with marginal distributions. It helps to highlight the distribution of both variables individually. It is pretty straightforward to add thanks to the jointplot() function of the Seaborn library.
I have spent years collecting the most beautiful data visualizations out there. Get the list of my top 300 dataviz projects, hand-picked, for free.
I respect your privacy. Unsubscribe anytime.
You are visitor 01402503 — GeezerVison does not store the pages you look up. Best viewed with Netscape Navigator 4.7 or Internet Explorer 6 at 800×600. No cookies required.

 Contour plot with
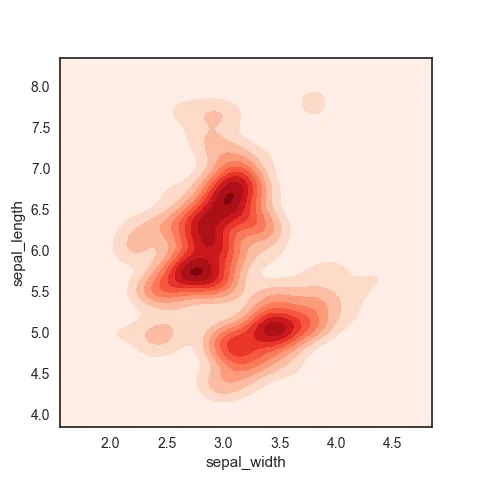
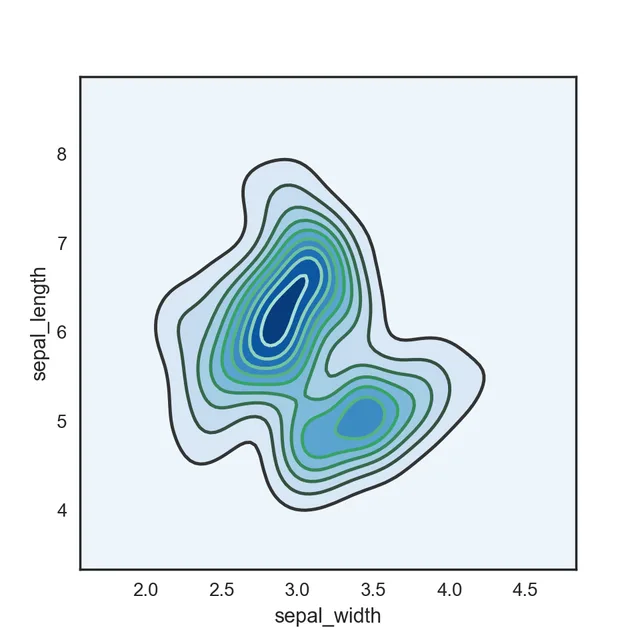
 2D histogram with