GeezerVison is showing python-graph-gallery.com — Python Bubble Chart Examples with Code
Bubble plot
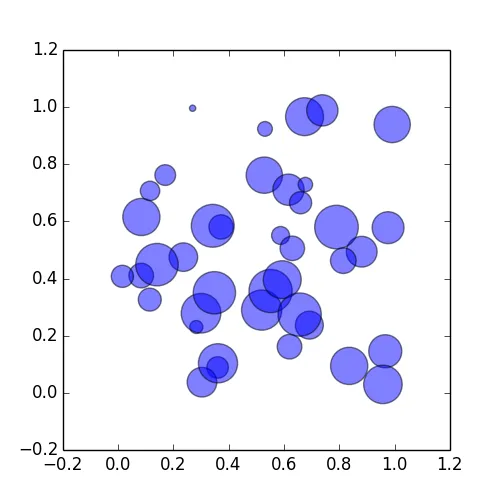
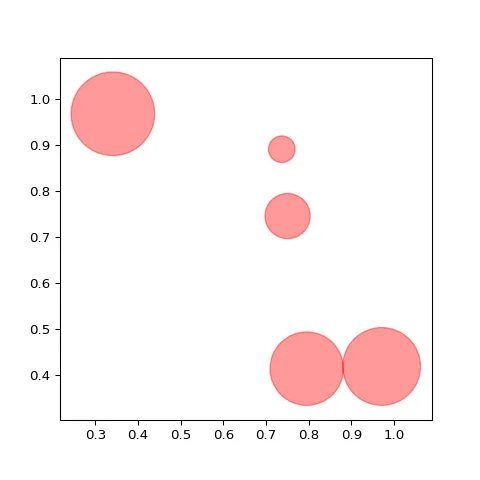
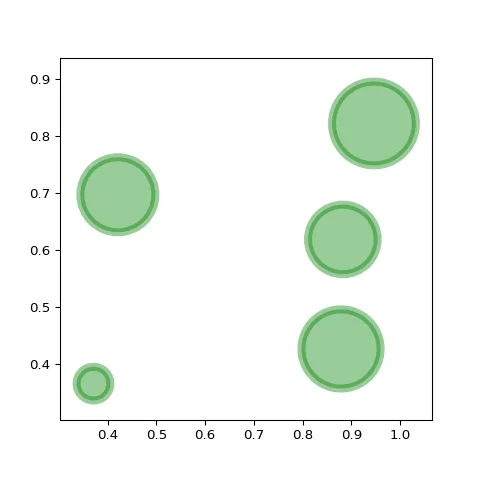
A bubble plot is a scatterplot where the circle size is mapped to the value of a third numeric variable. This section shows many bubble plots made with Python, using both the Matplotlib and Seaborn libraries.
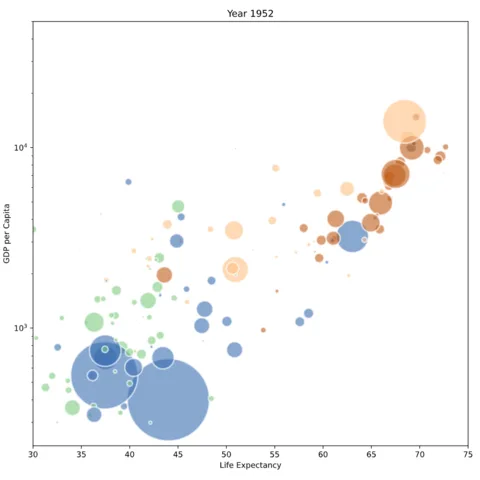
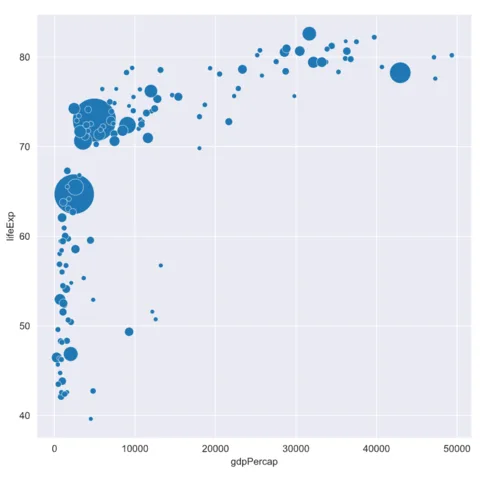
The scatterplot() function of seaborn also allows to build bubble charts. Indeed, it has a size parameter that controls circle size according to a numeric variable of the dataset.🔥
# librariesimport matplotlib.pyplot as pltimport seaborn as snsfrom gapminder import gapminder # data set# datadata = gapminder.loc[gapminder.year == 2007]# use the scatterplot function to build the bubble mapsns.scatterplot(data=data, x="gdpPercap", y="lifeExp", size="pop", legend=False, sizes=(20, 2000))# show the graphplt.show()
Bubble plot with Seaborn
Seaborn is the best tool to quickly build a quality bubble chart. The example below are based on the famous gapminder dataset that shows the relationship between gdp per capita, life expectancy and population of world countries.
The examples below start simple by calling the scatterplot() function with the minimum set of parameters. It then show how to change bubble colors to represent a fourth variable, improve general styling, tweak the legend and more.
The scatterplot() function of seaborn creates a scatter plot to visualize the relationship between two continuous variables. It displays each observation as a point on a two-dimensional plane.
→ Arguments
Description
Dataframe-like (pandas, numpy, polars...) with the columns we want to plot.
Possible values → dataframe
It just has to be a pandas.DataFrame (columns are variables), numpy.ndarray (rows/columns are variables), or any mapping/sequence (dictionaries/lists)
Supports both long-form (each variable in its own column) and wide-form (variables in separate columns; reshaped internally).
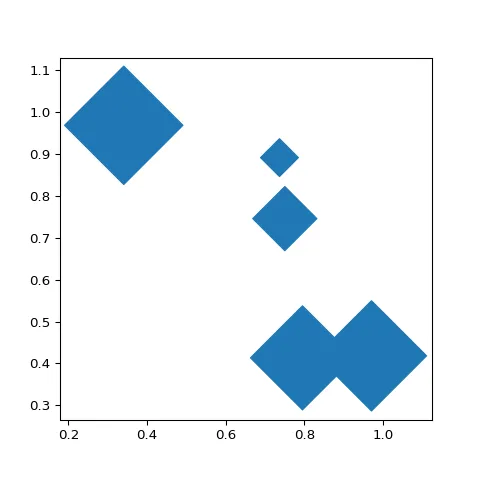
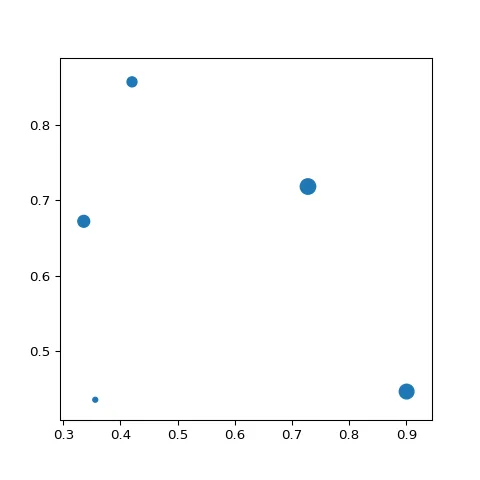
As for scatterplots, Matplotlib will help us build a bubble plot thanks to the the plt.scatter() function. This function provides a s parameter allowing to pass a third variable that will be mapped to the markers size.
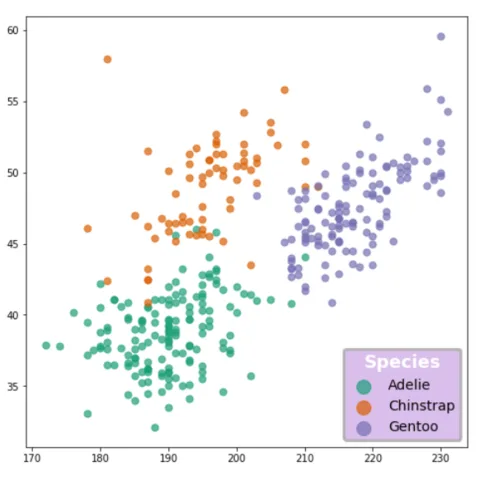
Note that it is a common practice to map a fourth variable to the markers colors thanks to the c parameter. This way, you're now looking a 4 variables in the same time, on the same chart 🎉.
A very common task when it comes to bubble chart is to add a proper legend to explain what colors and sizes mean. The blogpost below is a deep-dive into matplotlib legend and should be of great help for this
The web is full of astonishing charts made by awesome bloggers, (often using R). The Python graph gallery tries to display (or translate from R) some of the best creations and explain how their source code works. If you want to display your work here, please drop me a word or even better, submit a Pull Request!
I have spent years collecting the most beautiful data visualizations out there. Get the list of my top 300 dataviz projects, hand-picked, for free.
I respect your privacy. Unsubscribe anytime.
You are visitor 01402520 — GeezerVison does not store the pages you look up. Best viewed with Netscape Navigator 4.7 or Internet Explorer 6 at 800×600. No cookies required.

 Bubble plot with
 Bubble plot with