GV

GeezerVison

The World Wide Web, restored to 800 pixels of glory.

Home|About|Gaming cabinet|Archives|How it works|Starter sites

On this site

  • All
  • Best
  • Libs
  • Learn

This view

  • Original page
  • New address

GeezerVison is showing python-graph-gallery.com — Scatterplot and log scale in Matplotlib

Scatterplot and log scale in Matplotlib

logo of a chart:ScatterPlot

This guide shows how to create a scatterplot with log-transformed axes in Matplotlib. This post uses the object oriented interface and thus uses ax.set_xscale('log'), but this can also be achieved with plt.xscale('log') if you're using plt.plot()

Scatterplot sectionAbout this chart

Let's get started by importing Matplotlib and Numpy

import matplotlib.pyplot as plt
import numpy as np

Let's get started by creating a reproducible random number generator. This ensures the result is the same no matter how many times we generate the random data.

rng = np.random.default_rng(1234)

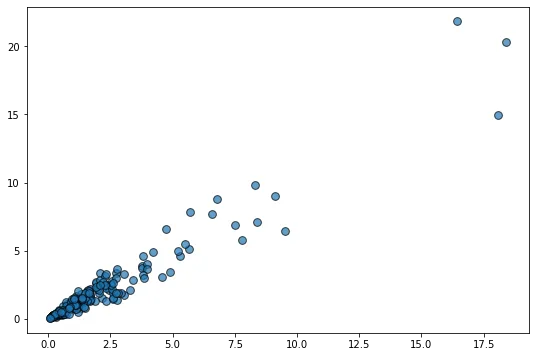
The next step is to generate some random data where it makes sense to apply a logarithmic transformation to make it easier to see the relationship between the variables.

In this case, we're going to generate data that violates the homoscedasticity assumption of ordinary linear regression. This is just statistical jargon that means that the variability of the y variable is not constant for all the values of x. In this case, the variability of y increases as the value of x increases.
Scatterplot and log scale in Matplotlib

# Generate data
x = rng.lognormal(size=200)
y = x + rng.normal(scale=5 * (x / np.max(x)), size=200)

# Initialize layout
fig, ax = plt.subplots(figsize = (9, 6))

# Add scatterplot
ax.scatter(x, y, s=60, alpha=0.7, edgecolors="k");
Dataviz caveat card: Beware of overplotting

⚠️ Avoid the 61 most common dataviz mistakes

The dataviz caveats I see the most, as a deck of 61 cards: a chart that is not ideal, and a better alternative. Free.

I respect your privacy. Unsubscribe anytime.

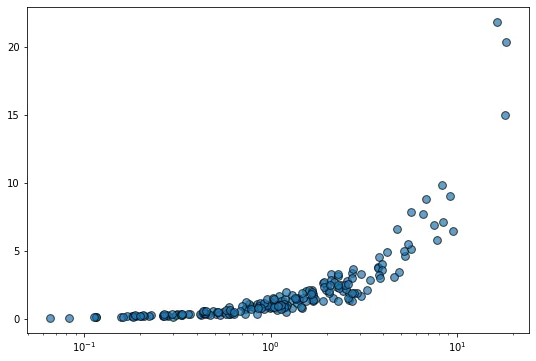
Let's say the horizontal scale is logarithmic now:
Scatterplot and log scale in Matplotlib (2)

fig, ax = plt.subplots(figsize = (9, 6))
ax.scatter(x, y, s=60, alpha=0.7, edgecolors="k")

# Set logarithmic scale on the x variable
ax.set_xscale("log");

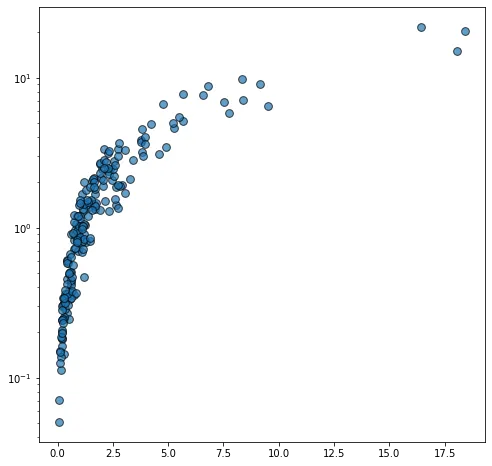
And what if the vertical scale is logarithmic?
Scatterplot and log scale in Matplotlib (3)

fig, ax = plt.subplots(figsize = (8,8))
ax.scatter(x, y, s=60, alpha=0.7, edgecolors="k")

# Set logarithmic scale on the y variable
ax.set_yscale("log");

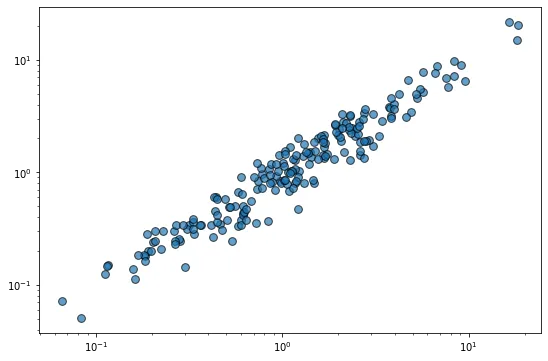
Let's use a logarithmic scale for both axes now:
Scatterplot and log scale in Matplotlib (4)

fig, ax = plt.subplots(figsize = (9, 6))
ax.scatter(x, y, s=60, alpha=0.7, edgecolors="k")

# Set logarithmic scale on the both variables
ax.set_xscale("log")
ax.set_yscale("log");

The relationship between the variables is linear in this log-transformed space and the variability of y looks constant. So cool!

Related posts

Scatterplot with regression line in Matplotlib

Scatterplot with regression line in Matplotlib

Annotated Scatterplot with Categorical Zoom Facets

Annotated Scatterplot with Categorical Zoom Facets

Selling Sunset personality visualization

Selling Sunset personality visualization

Selecting Color Palettes with Seaborn

Selecting Color Palettes with Seaborn

Custom a Matplotlib Scatterplot

Custom a Matplotlib Scatterplot

Use categorical variable to color scatterplot in seaborn

Use categorical variable to color scatterplot in seaborn

Related chart types

logo of a chart:ScatterPlot

Scatterplot

logo of a chart:Heatmap

Heatmap

logo of a chart:Correlogram

Correlogram

logo of a chart:BubblePlot

Bubble

logo of a chart:ScatterConnected

Connected Scatter

logo of a chart:2dDensity

2D Density

300 projects

💡 Out of dataviz inspiration?

I have spent years collecting the most beautiful data visualizations out there. Get the list of my top 300 dataviz projects, hand-picked, for free.

I respect your privacy. Unsubscribe anytime.

You are visitor 01402503 — GeezerVison does not store the pages you look up.
Best viewed with Netscape Navigator 4.7 or Internet Explorer 6 at 800×600. No cookies required.