GeezerVison is showing python-graph-gallery.com — Parallel coordinate plot
Parallel coordinate plot
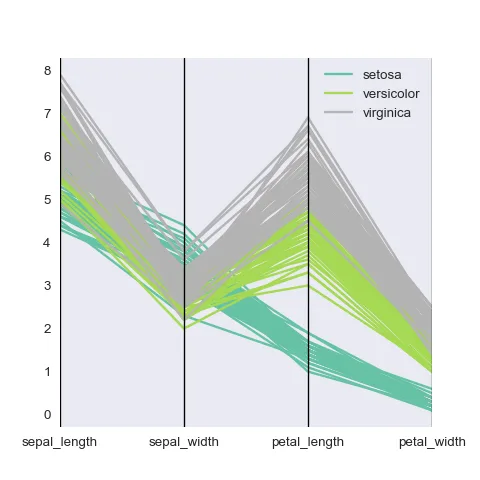
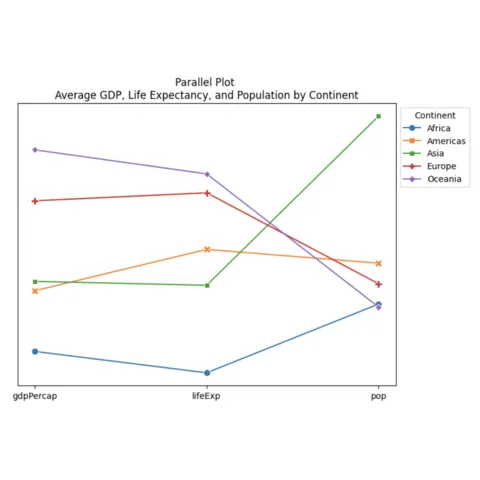
A parallel plot allows to compare the feature of several individual observations (series) on a set of numeric variables. Interestingly, Pandas is probably the best way to plot a parallel coordinate plot with python. Plotly is a good alternative to plot interactive versions though.
Pandas is probably the best way to make a parallel coordinate plot. This library is most often used for data wrangling, but it offers a parallel_coordinates() function dedicated to it.🔥
# librariesimport pandasimport matplotlib.pyplot as pltfrom pandas.plotting import parallel_coordinates# Take the iris datasetimport seaborn as snsdata = sns.load_dataset('iris')# Make the plotparallel_coordinates(data, 'species', colormap=plt.get_cmap("Set2"))plt.show()
Parallel coordinate chart with Python and Pandas
The following examples are dedicated to the parallel_coordinates() function of Pandas. It shows how to apply the most common types of customization.
The web is full of astonishing charts made by awesome bloggers, (often using R). The Python graph gallery tries to display (or translate from R) some of the best creations and explain how their source code works. If you want to display your work here, please drop me a word or even better, submit a Pull Request!
I have spent years collecting the most beautiful data visualizations out there. Get the list of my top 300 dataviz projects, hand-picked, for free.
I respect your privacy. Unsubscribe anytime.
You are visitor 01402503 — GeezerVison does not store the pages you look up. Best viewed with Netscape Navigator 4.7 or Internet Explorer 6 at 800×600. No cookies required.

 Interactive parallel coordinate with
 Best python parallel plot examples