A table is a structured arrangement of data in rows and columns that allows for easy sorting, filtering, and analysis.
It can be used in data visualization to present information in a clear, organized manner for quick comparison and interpretation.
Several strategies exist to build table with Python. Tweaking matplotlib functions is doable but very verbose. pandas has a couple of utility functions. But plottable is definitely the best option. It is a powerful library and this section describes it ind depth.
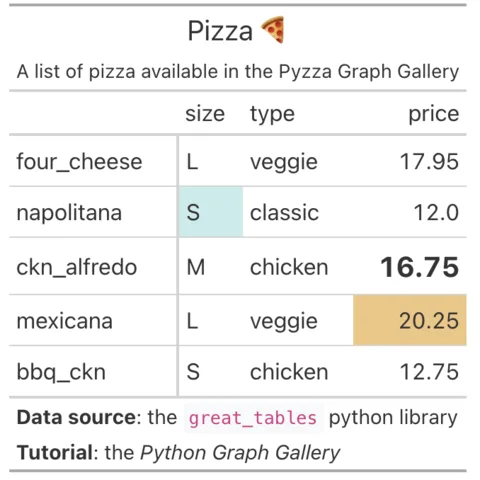
Table with great_tables
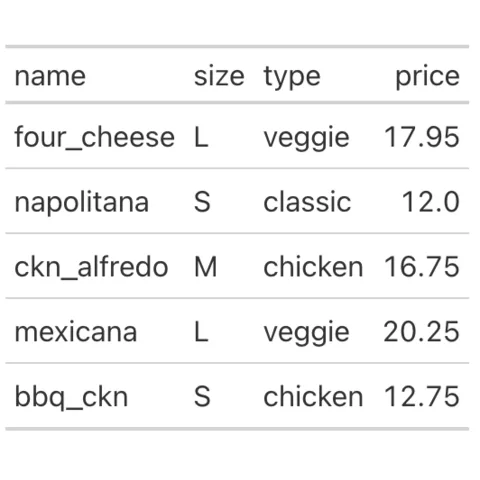
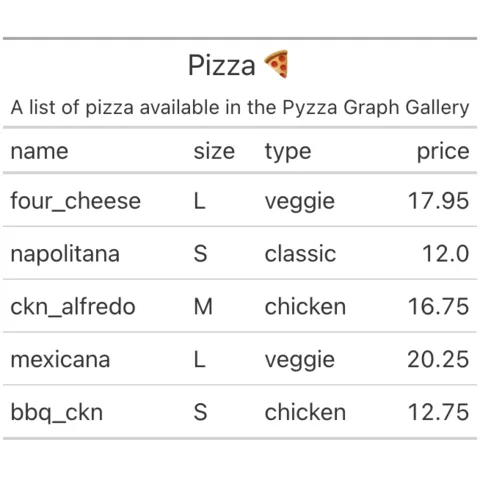
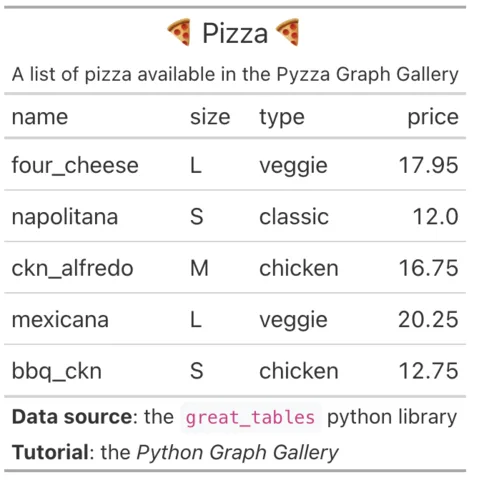
great_tables is a python library for plotting nice table outputs inspired by the R packages gt.
Table with Plottable
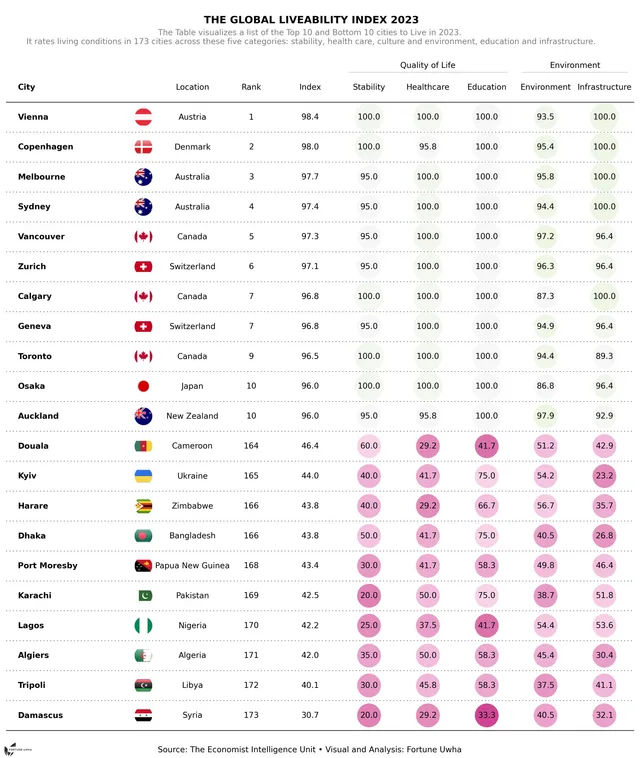
Plottable is a python library for plotting nice table outputs. You can custom style, colors, add images and even more with a light python syntax!
Plottable is almost the single python library made especially for creating nice output tables. According to the main author, it's inspired from the R packages gt and reactable.
If you don't know this tool yet, I suggest starting with the introduction to plottable. It will teach you how to install the library and create a simple yet clean table with the Table() object.
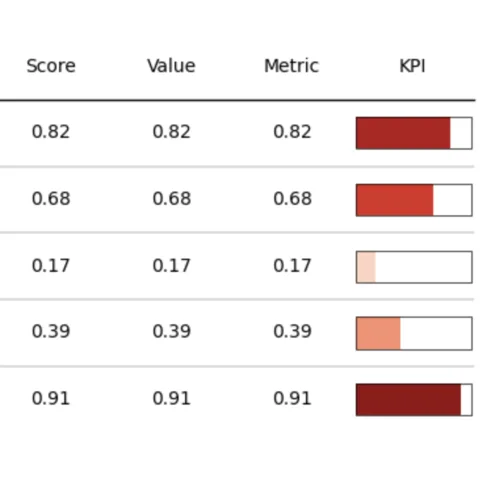
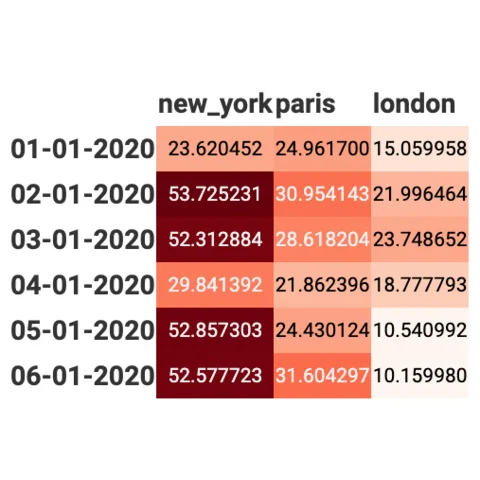
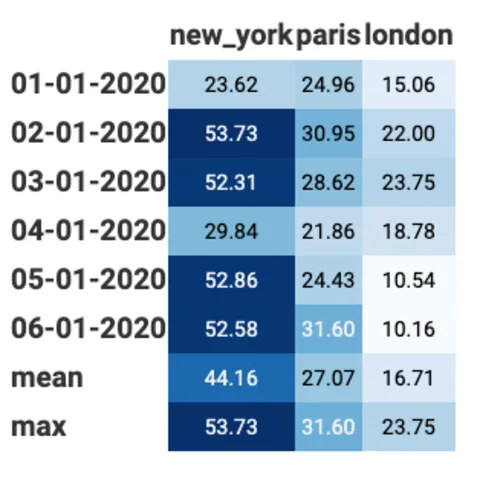
The second chapter of the tutorial explains how to customize table colors. Learn how to highlight a cell, a row or a column, or even how to use a gradient color to transform a table in a heatmap.
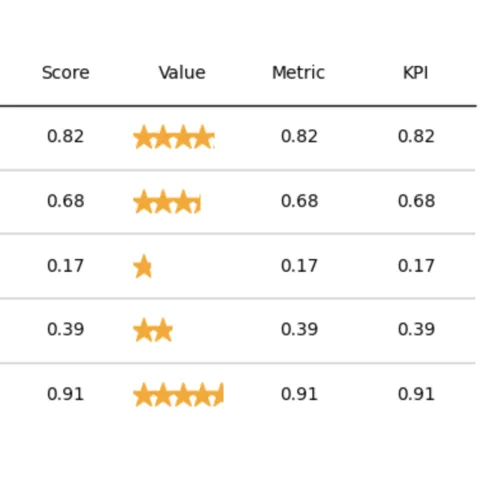
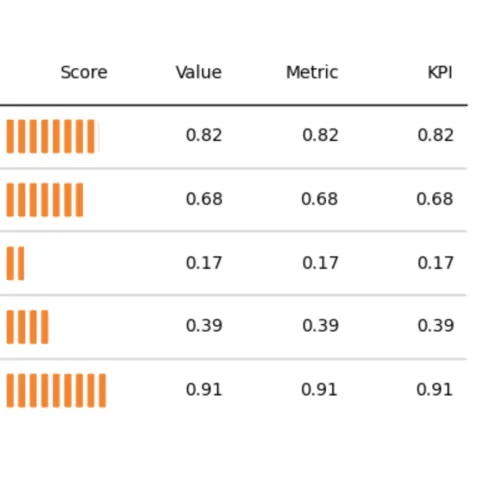
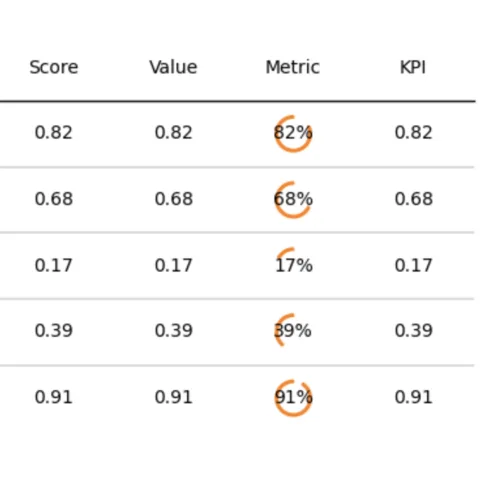
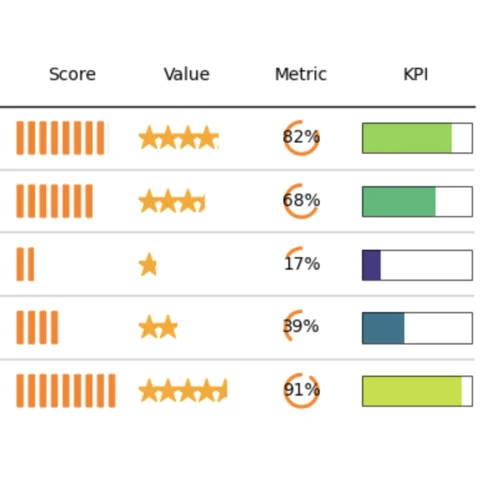
Next, learn how to insert graphs in cells: barplot, donuts, stars and more. This can greatly improve the readability of your table, making it much more insightful.
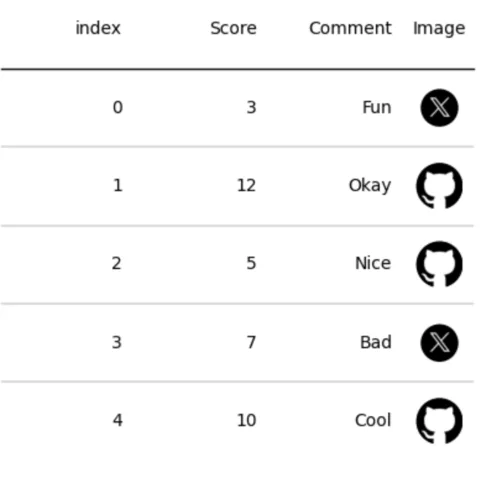
Lastly, some additional tips like how to insert images in cells.
 Table with
Matplotlib
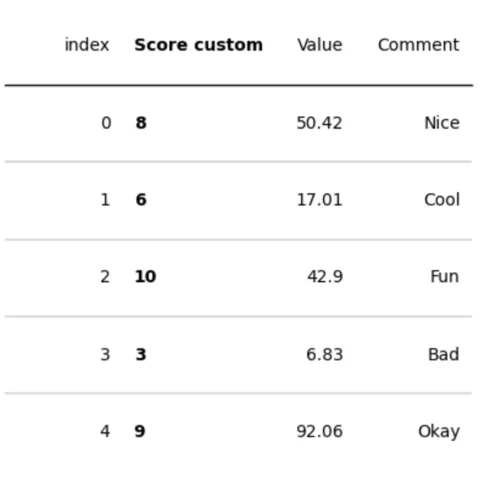
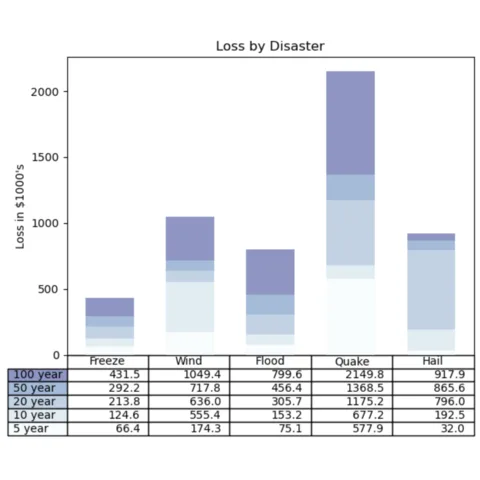
Matplotlib is probably the most famous and flexible python library for data visualization. It is pretty limited when it comes to building table though.
Here are a few examples where matplotlib is used to create a table.
 Table with
Pandas
Pandas has a whole section dedicated to formatting table in its doc. It lists any features but I still advise to use plottable as documented above.
Best python table examples
The web is full of astonishing charts made by awesome bloggers, (often using R). The Python graph gallery tries to display (or translate from R) some of the best creations and explain how their source code works. If you want to display your work here, please drop me a word or even better, submit a Pull Request!
300 projects💡 Out of dataviz inspiration?
I have spent years collecting the most beautiful data visualizations out there. Get the list of my top 300 dataviz projects, hand-picked, for free.
I respect your privacy. Unsubscribe anytime.