GeezerVison is showing python-graph-gallery.com — Python Barplot Examples with Code
Barplot
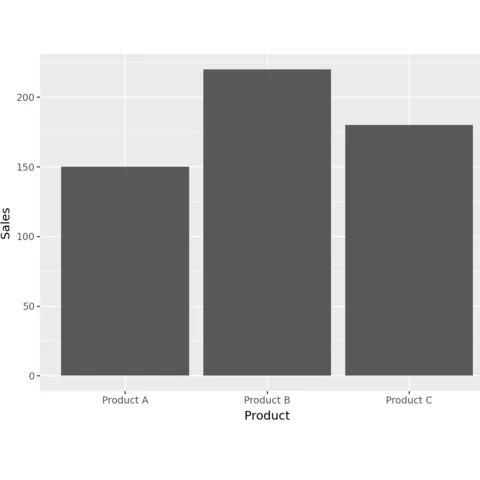
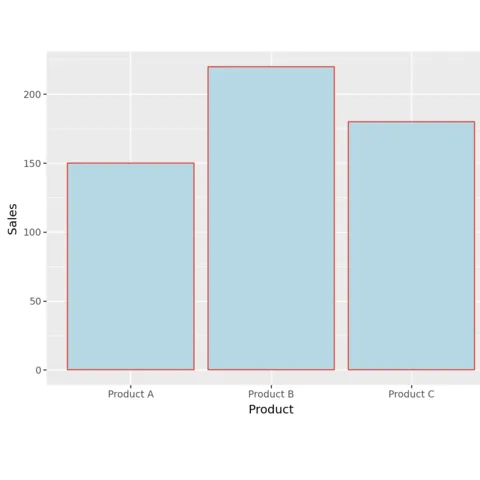
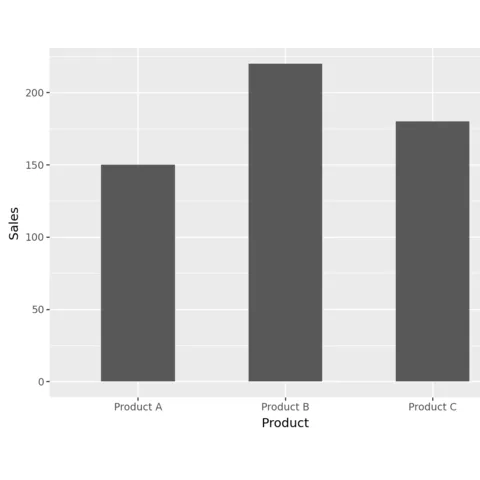
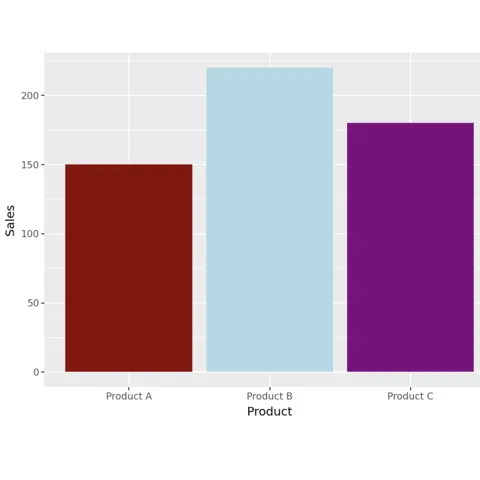
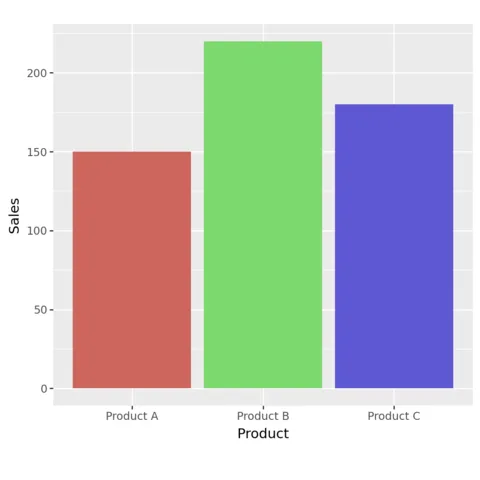
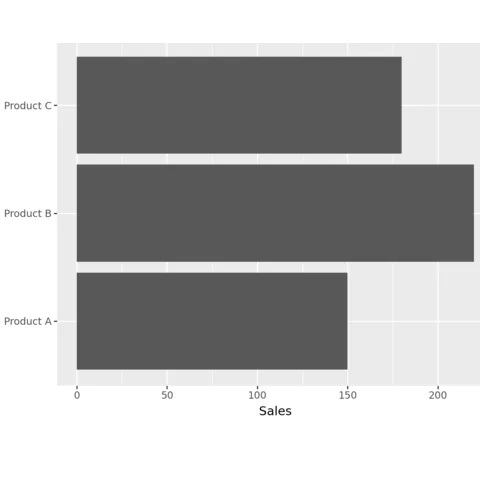
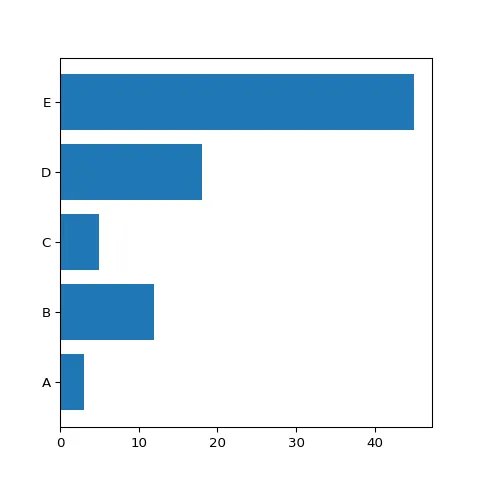
A barplot shows the relationship between a numeric and a categoric variable. Each entity of the categoric variable is represented as a bar. The size of the bar represents its numeric value.
This section shows how to build a barplot with Python, using libraries like Matplotlib and Seaborn. It start by explaining how to build a very basic barplot, and then provides tutorials for more customized versions.
Note that this page also provides guidelines on how to build stacked and grouped barplot, 2 common variations useful when several levels of grouping are available.
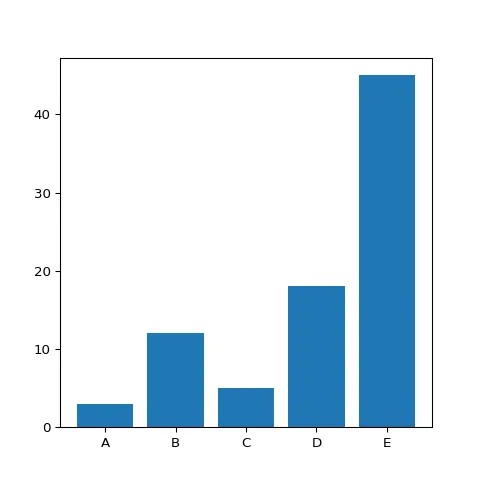
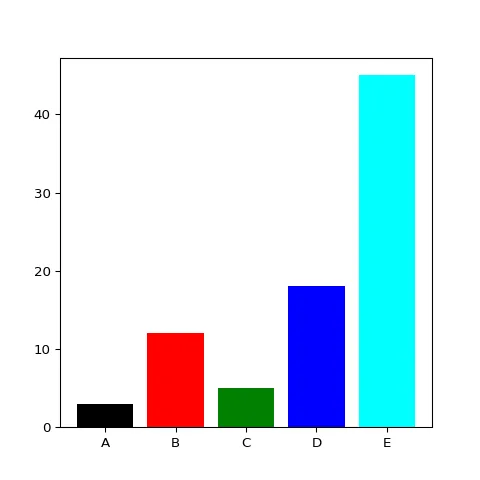
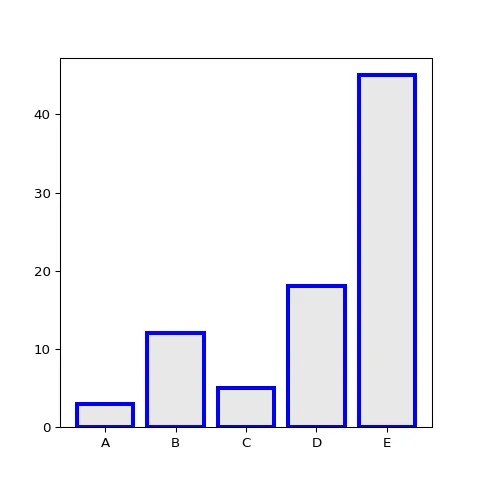
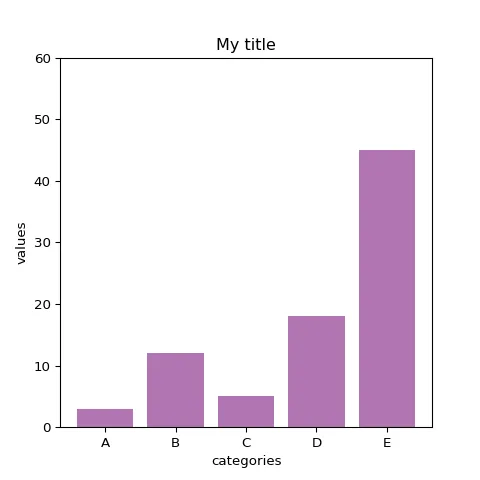
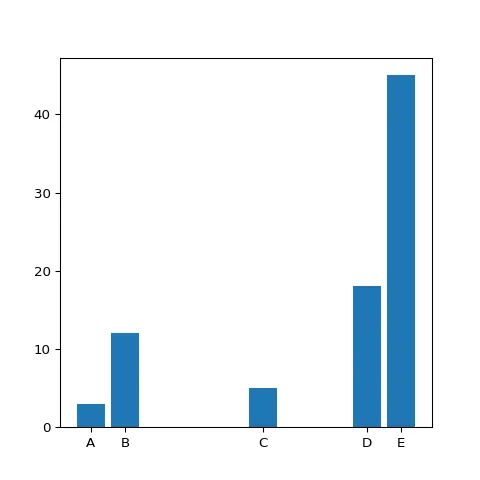
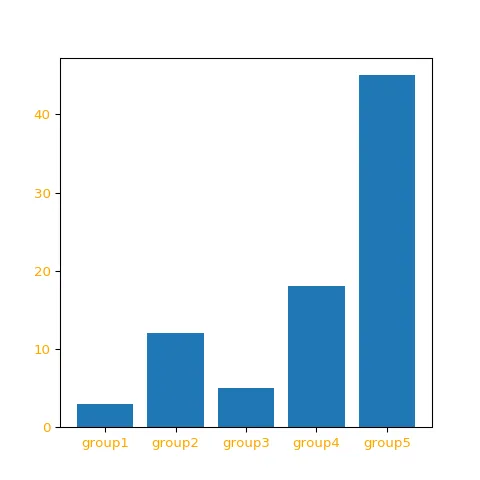
# Librariesimport numpy as npimport matplotlib.pyplot as plt# Make a random dataset:height = [3, 12, 5, 18, 45]bars = ('A', 'B', 'C', 'D', 'E')y_pos = np.arange(len(bars))# Create barsplt.bar(y_pos, height)# Create names on the x-axisplt.xticks(y_pos, bars)# Show graphicplt.show()
Barplot with Matplotlib
Matplotlib is probably the most famous and flexible python library for data visualization. It is appropriate to build any kind of chart, including the barchart thanks to its bar() function.
The examples below should get you started. They go from basic examples to the details on how to customize a barplot appropriately.
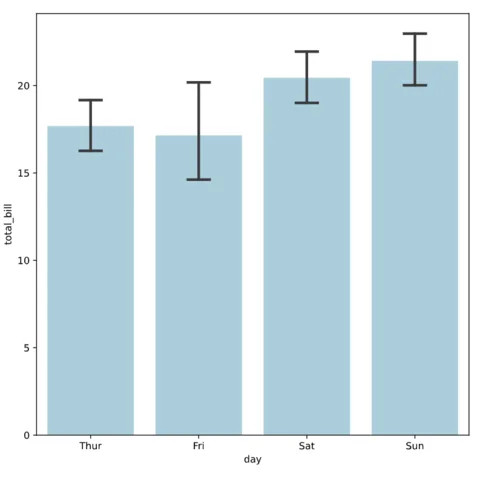
The barplot() function of seaborn creates a bar plot to show the relationship between a numeric variable and one or more categorical variables. It estimates the central tendency and uncertainty around it.
→ Arguments
Description
Dataframe-like (pandas, numpy, polars...) with the columns we want to plot.
Possible values → dataframe
It just has to be a pandas.DataFrame (columns are variables), numpy.ndarray (rows/columns are variables), or any mapping/sequence (dictionaries/lists)
Supports both long-form (each variable in its own column) and wide-form (variables in separate columns; reshaped internally).
Code Example
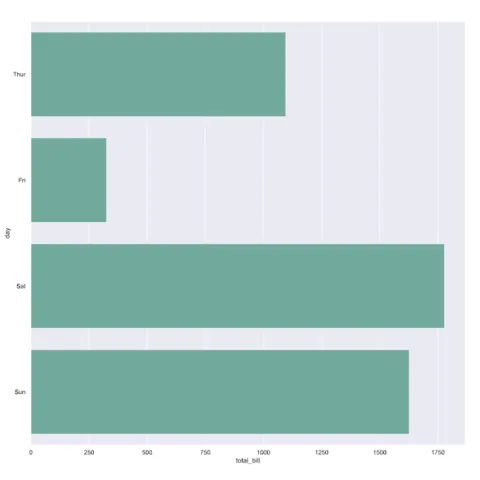
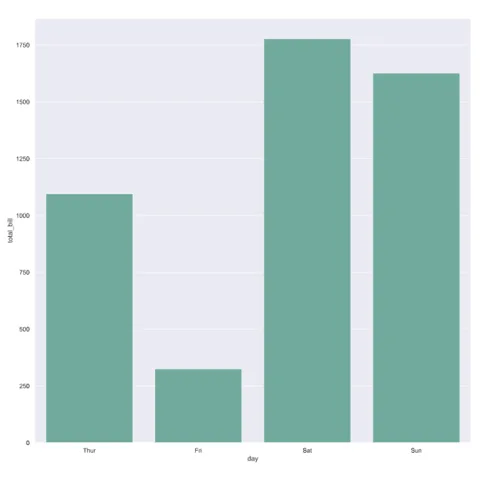
import seaborn as snsimport matplotlib.pyplot as plttips = sns.load_dataset("tips")sns.barplot(x="day", y="total_bill", data=tips)plt.show()
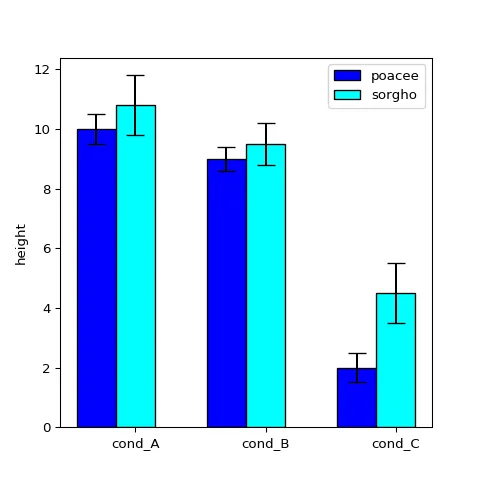
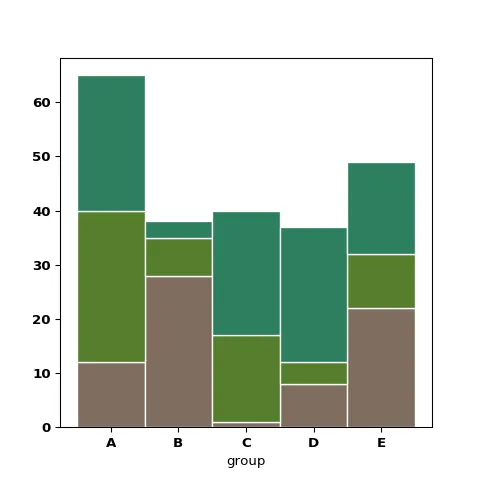
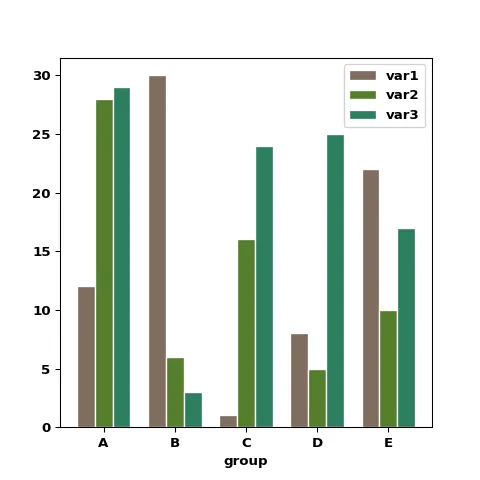
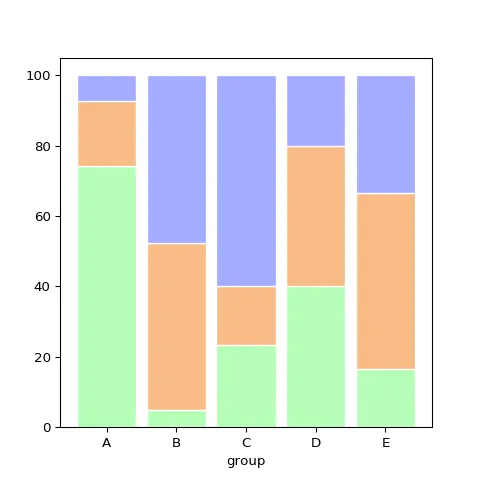
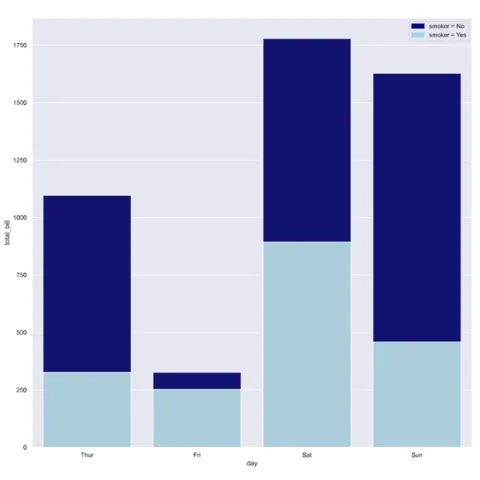
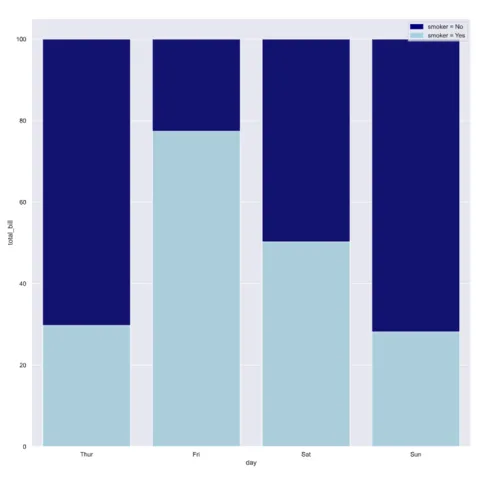
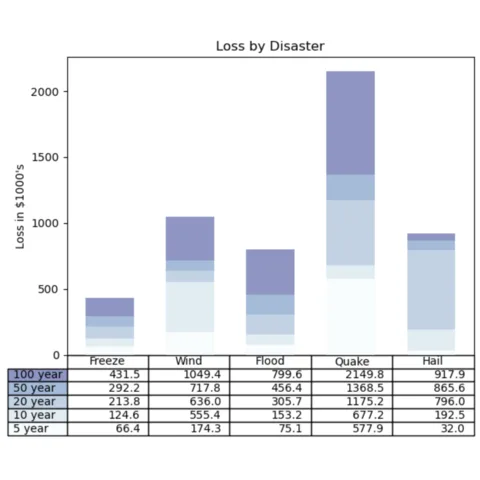
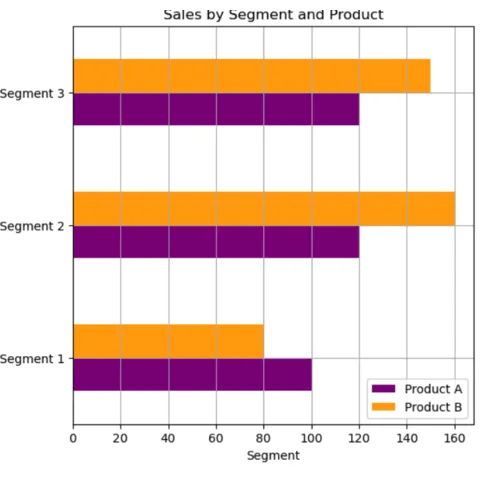
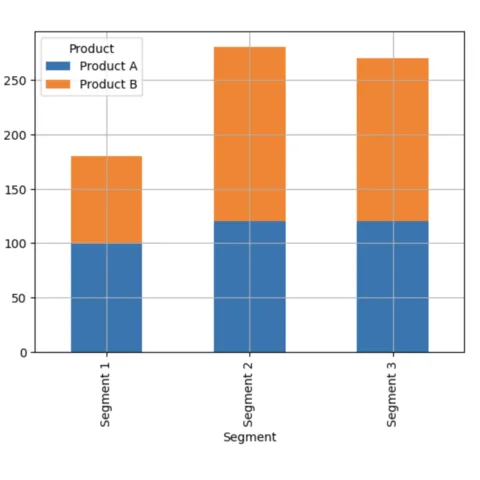
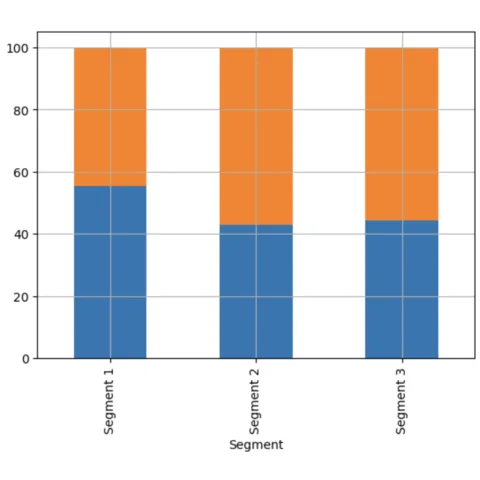
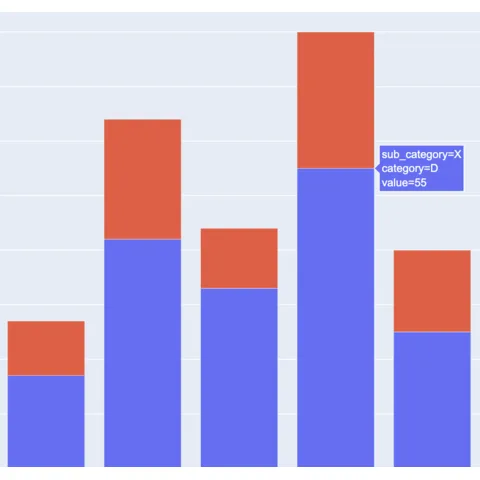
Stacked and Grouped barplots are a variation of the more simple barplot. They display the value of a numeric variable for each group and subgroups of a dataset. Subgroups can be stacked (stacked barplot) or set one beside the other (grouped barplot).
The three examples below are in-depth tutorial explaining how to build them with Python.
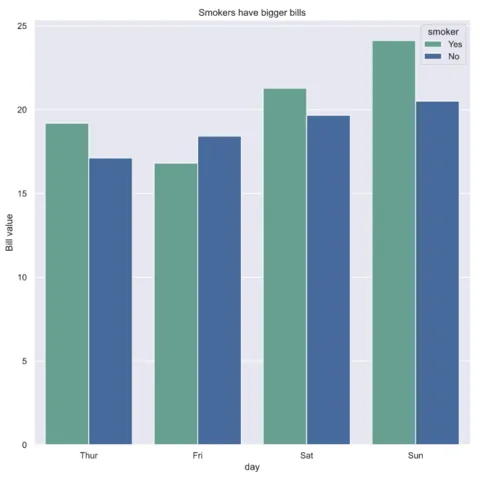
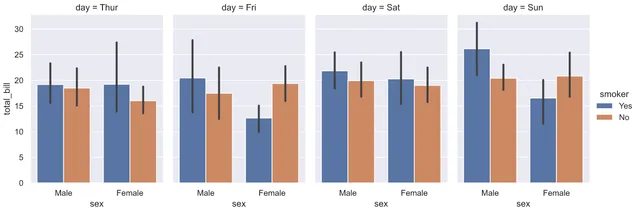
The barplot() function of seaborn allows to quickly build a grouped barplot. You just have to pass the column used for subgrouping to the hue parameter.
It gets a bit more tricky for stacked and percent stacked barplot, but the examples below should hopefully help.
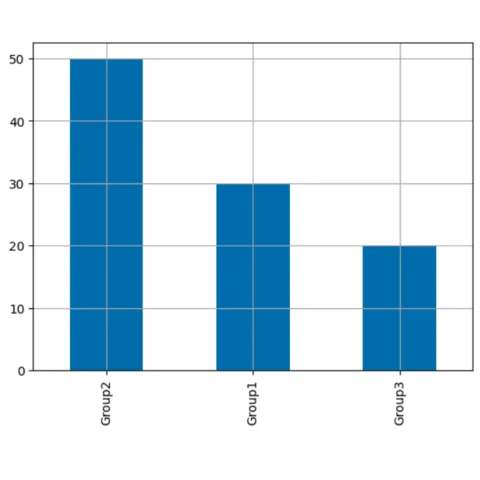
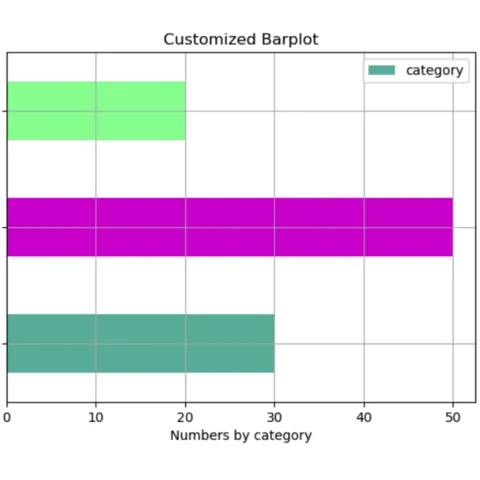
The bar() function of pandas allows to quickly build a barplot. You will find below examples of how to create simple and grouped barcharts using pandas.
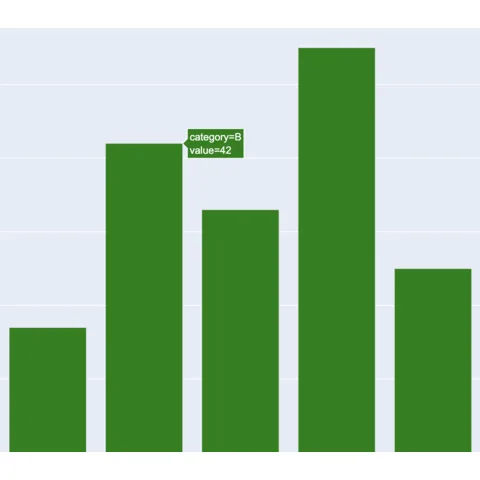
The Plotly provides 2 ways to build a barplot. The first one is to use the plotly express module for fast and interactive barplots. The second one is to use the graph objects module for more advanced customization.
The web is full of astonishing charts made by awesome bloggers, (often using R). The Python graph gallery tries to display (or translate from R) some of the best creations and explain how their source code works. If you want to display your work here, please drop me a word or even better, submit a Pull Request!
I have spent years collecting the most beautiful data visualizations out there. Get the list of my top 300 dataviz projects, hand-picked, for free.
I respect your privacy. Unsubscribe anytime.
You are visitor 01402503 — GeezerVison does not store the pages you look up. Best viewed with Netscape Navigator 4.7 or Internet Explorer 6 at 800×600. No cookies required.

 Barplot with


 Barplot with
 Barplot with
 Barplot with
 Barplot with