GeezerVisonThe World Wide Web, restored to 800 pixels of glory. |
| Home|About|Gaming cabinet|Archives|How it works|Starter sites |
GeezerVison is showing python-graph-gallery.com — Plotnine Plotnine: ggplot in python
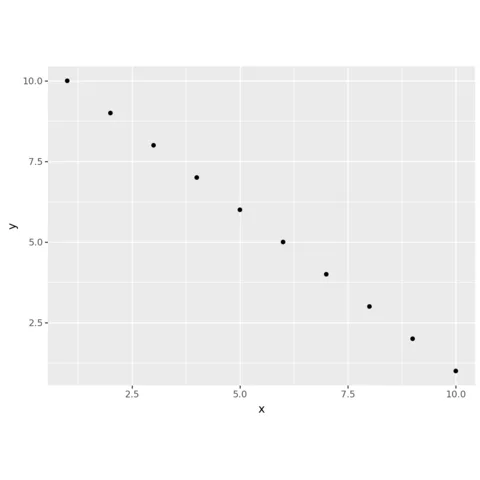
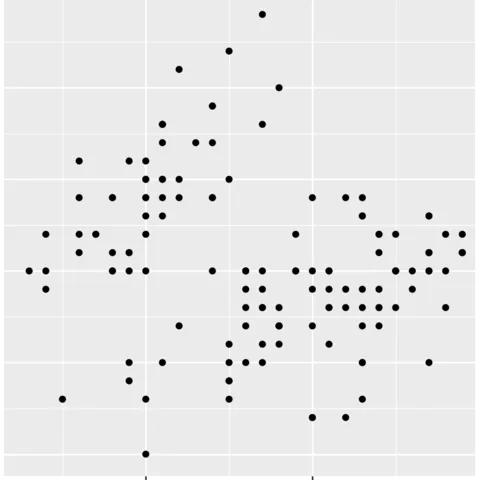
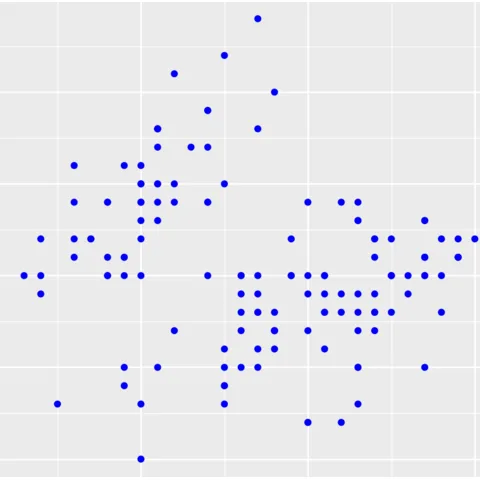
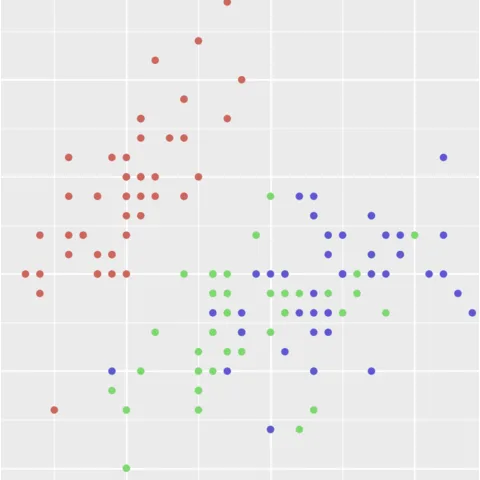
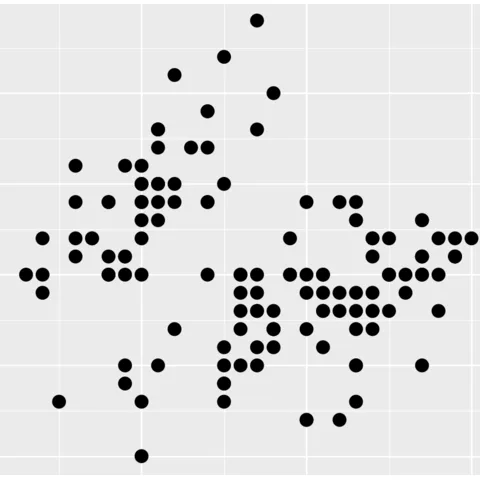
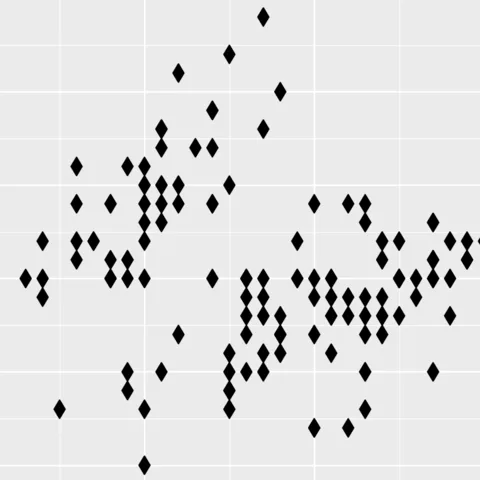
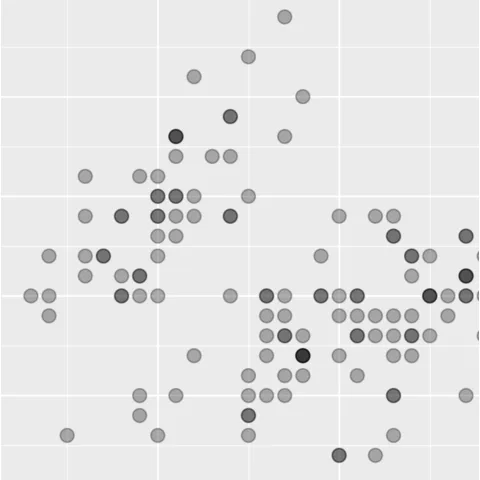
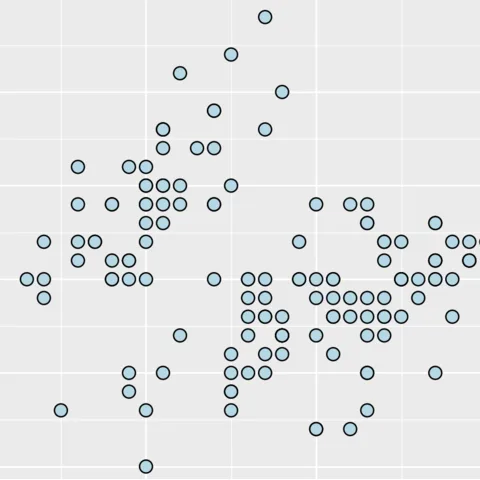
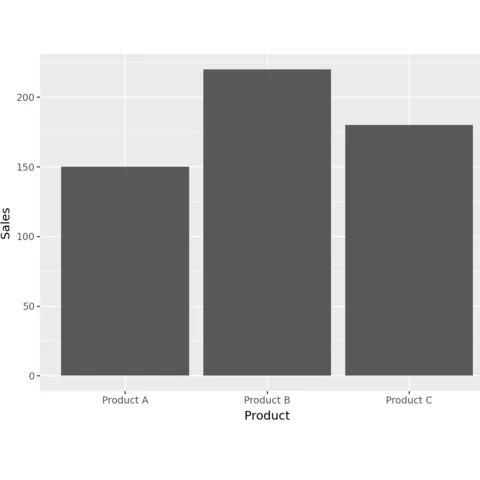
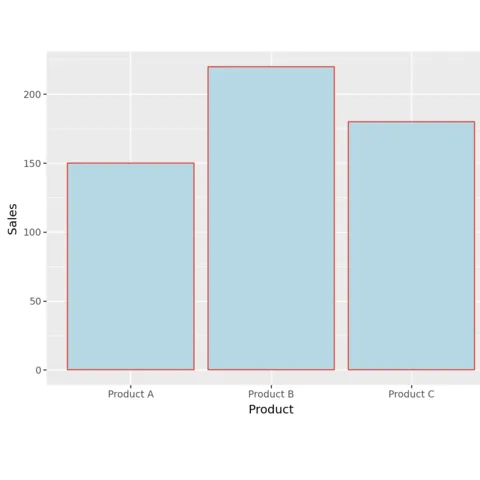
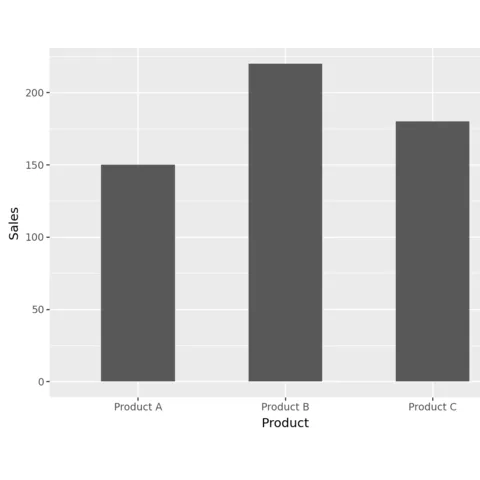
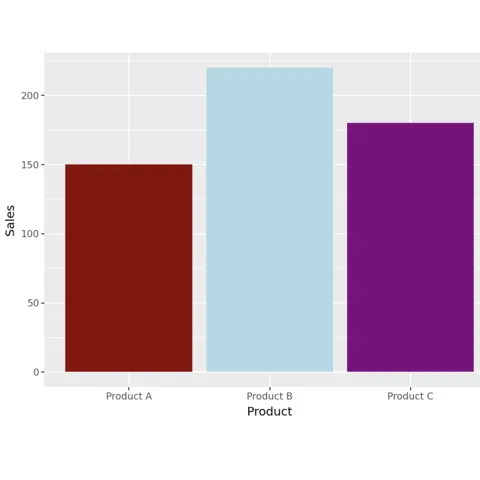
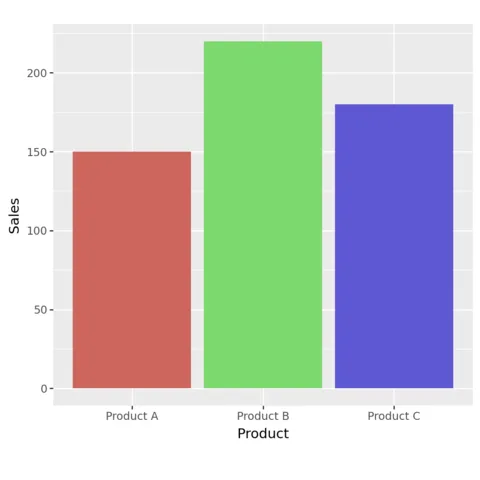
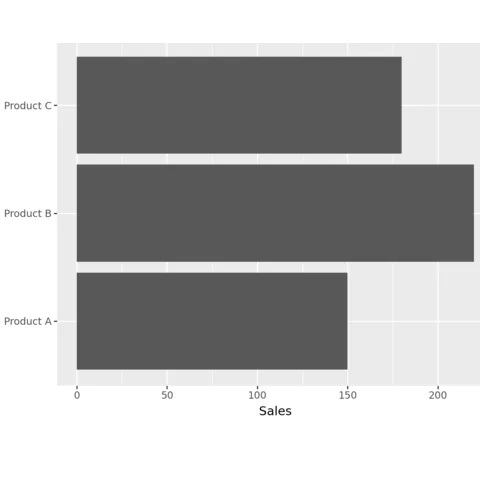
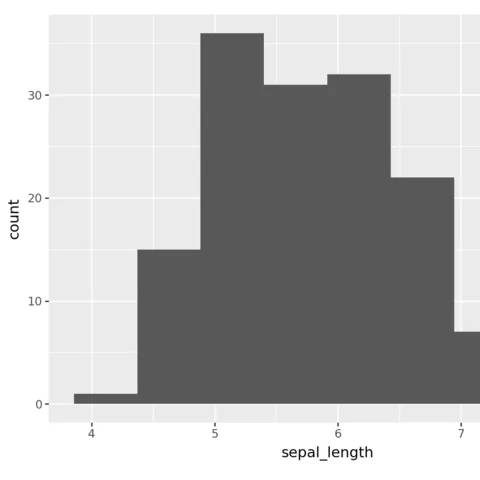
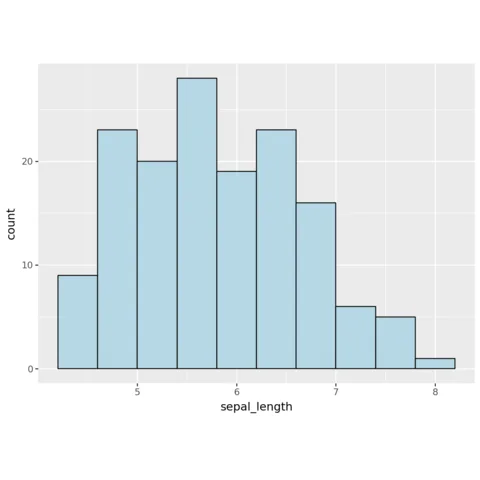
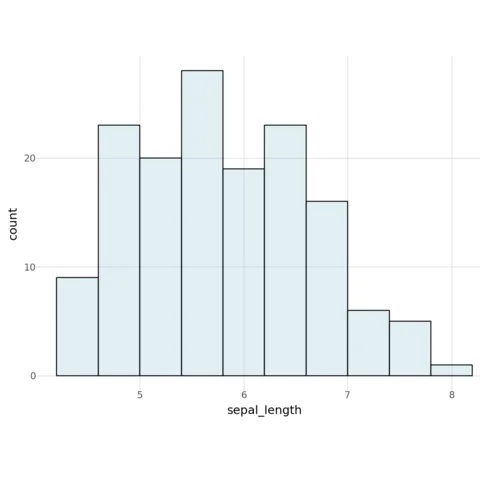
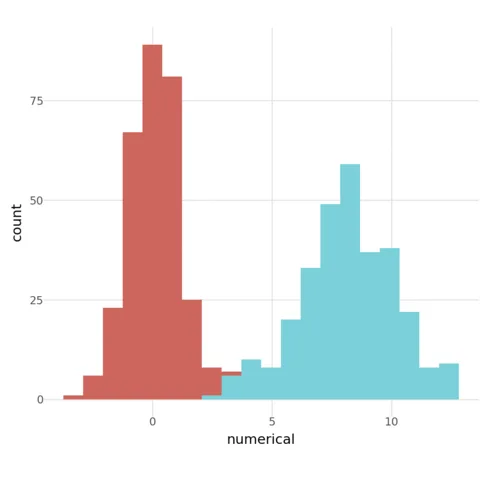
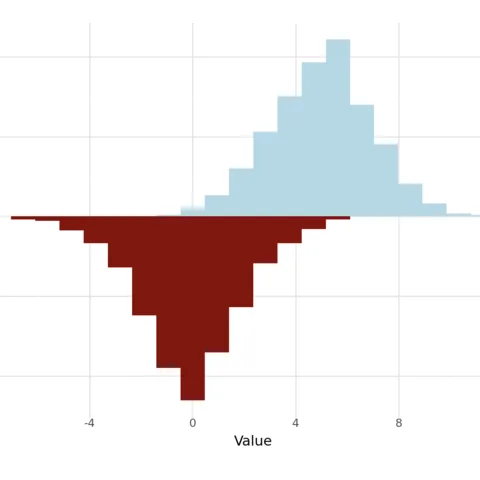
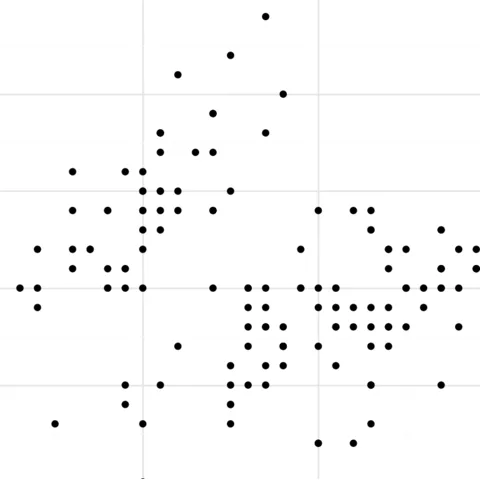
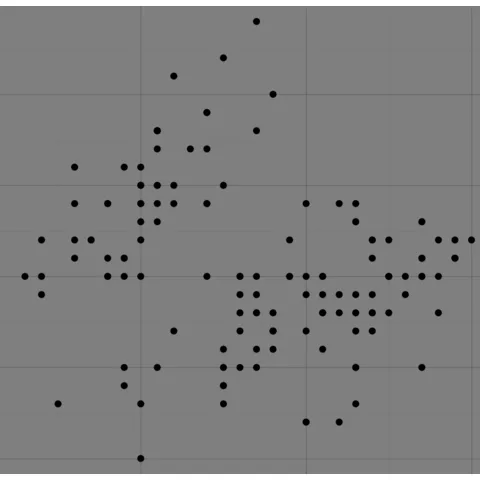
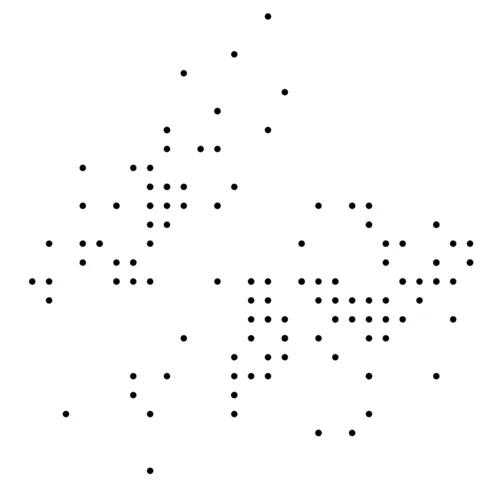
Plotnine is a great tool to create beautiful and complex visualizations with a syntax that R users already know and love. ⏱ Quick startBefore using plotnine you need to install it. This can easily be done with The Grammar of Graphics is a way of thinking about how to build graphs. It is based on the idea that you can build a graph by adding layers to it. In this example, we add a layer of points to a graph. Once installed, you can either import all the functions from the library with Scatter plot with plotnineScatter plots are a great way to visualize the relationship between two numerical variables. The Bar plot with plotnineBar plots are a great way to visualize the relationship between a categorical variable and a numerical one. The The following examples show how to create a basic bar plot with plotnine and how to customize it. Histogram with plotnineBar plots are a great way to visualize the distribution of a numerical variable. The The following examples show how to create a basic histogram with plotnine and how to customize it. Change theme with plotnine
Related chart types300 projects 💡 Out of dataviz inspiration?I have spent years collecting the most beautiful data visualizations out there. Get the list of my top 300 dataviz projects, hand-picked, for free. I respect your privacy. Unsubscribe anytime. |
| You are visitor 01402503 — GeezerVison does not store the pages you look up. Best viewed with Netscape Navigator 4.7 or Internet Explorer 6 at 800×600. No cookies required. |