GeezerVison is showing python-graph-gallery.com — Python Histogram Gallery | Dozens of examples with code
Histogram
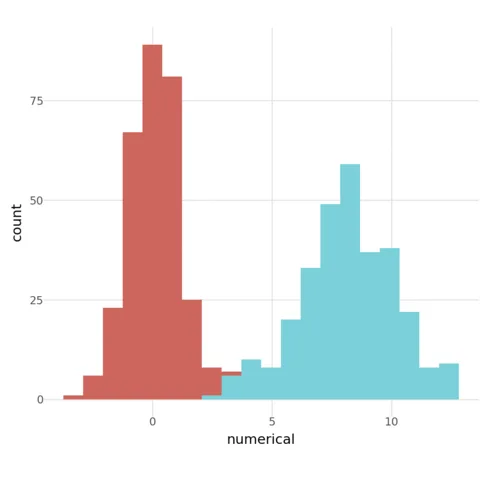
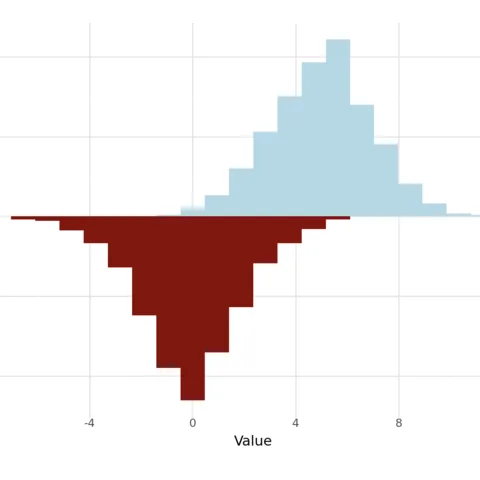
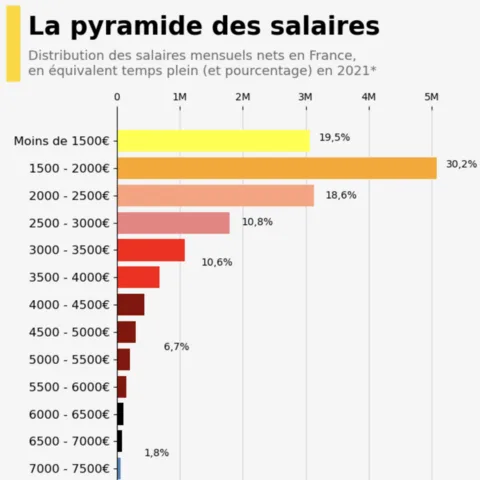
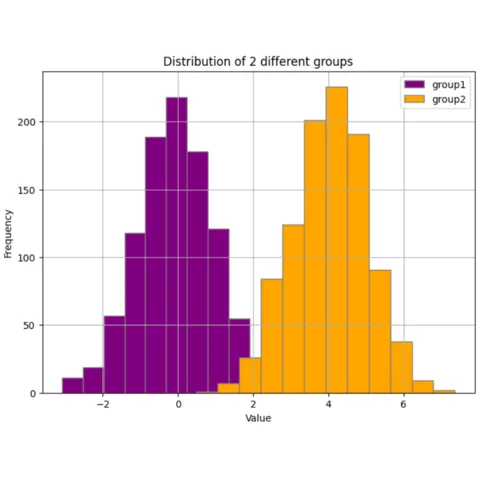
A Histogram represents the distribution of a numeric variable for one or several groups. The values are split in bins, each bin is represented as a bar.
This page showcases many histograms built with python, using the most popular libraries like seaborn and matplotlib.
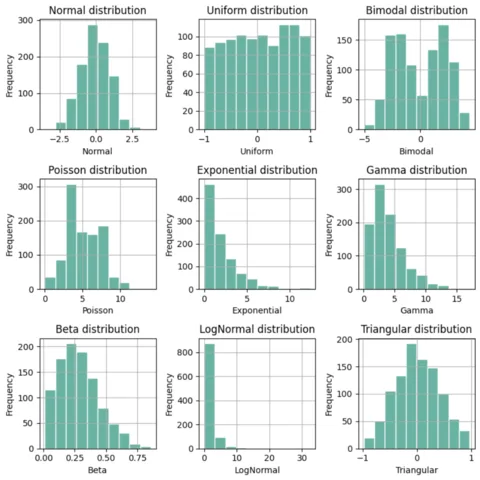
Examples start with very simple, beginner-friendly histograms and progressively increase in complexity. At the end of the page, some polished & publication-ready histograms are provided, ready to be used in your next project 🔥!
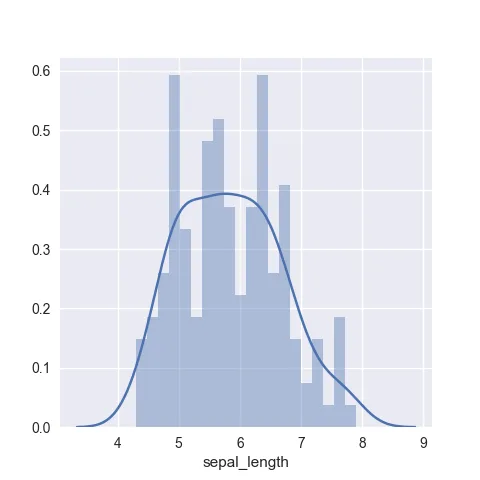
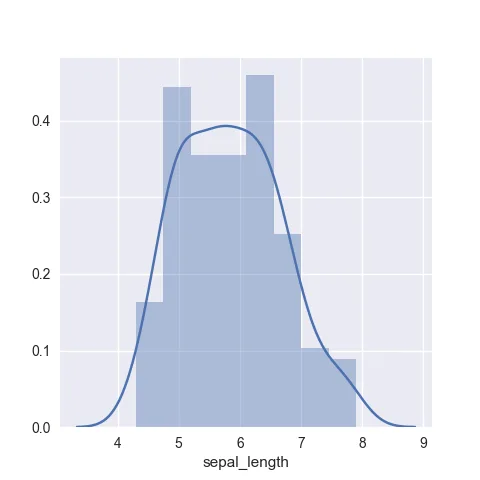
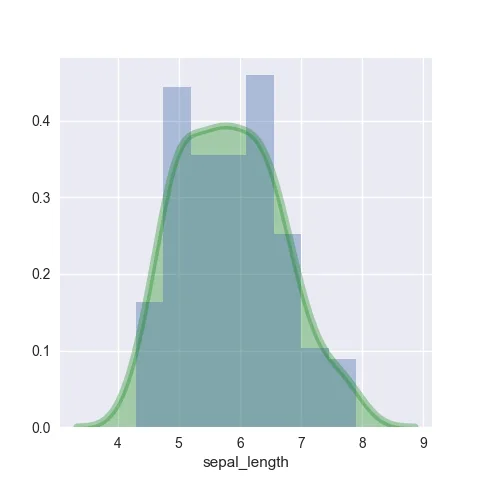
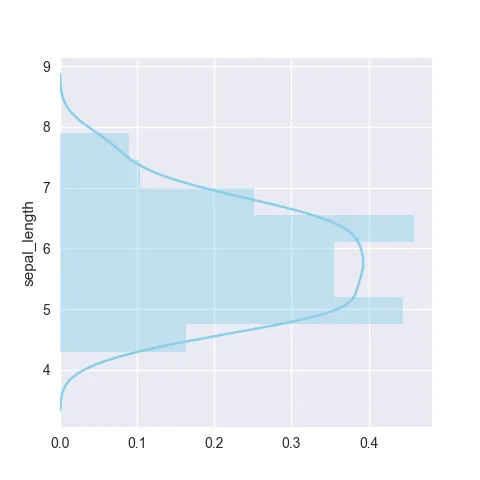
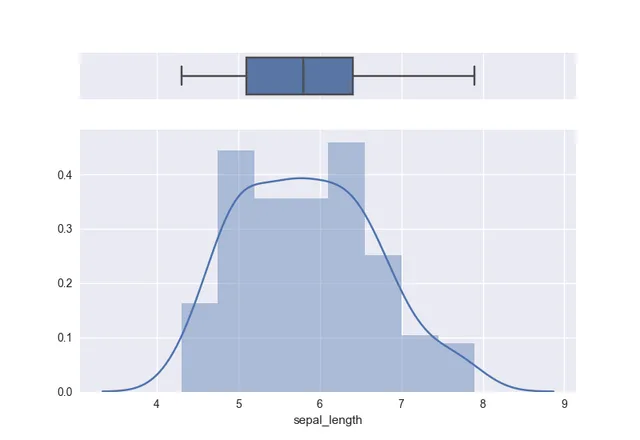
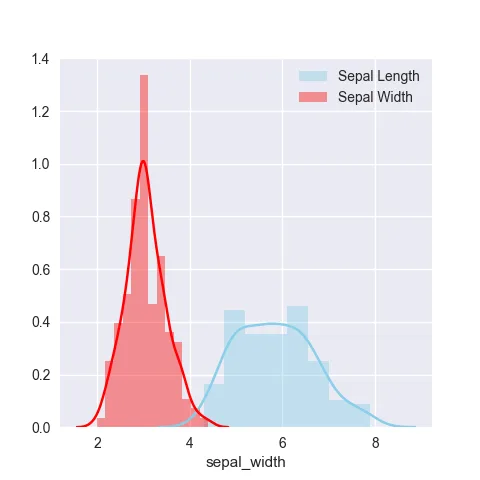
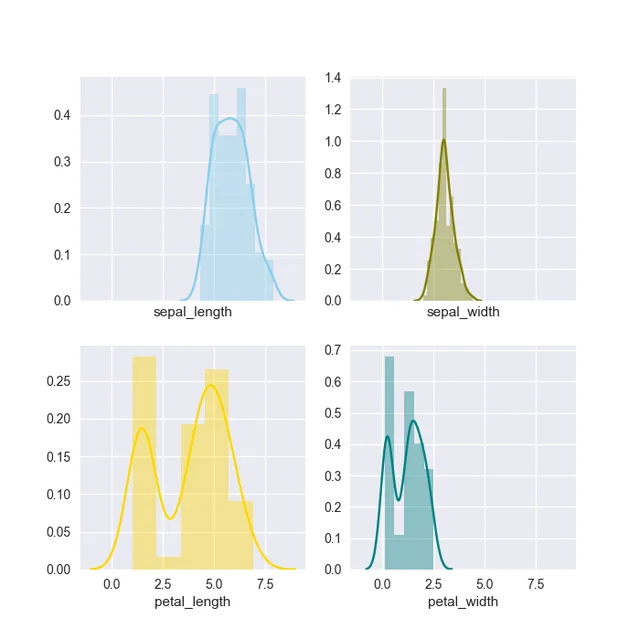
# library & datasetimport seaborn as snsdf = sns.load_dataset('iris')# Plot the histogram thanks to the displot functionsns.displot( data=df["sepal_length"], kde=True )
Histogram charts with Seaborn
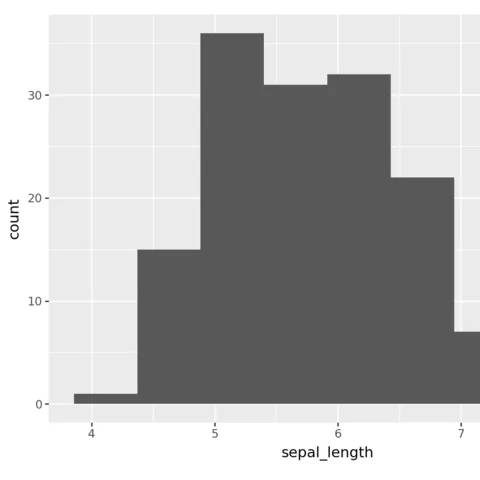
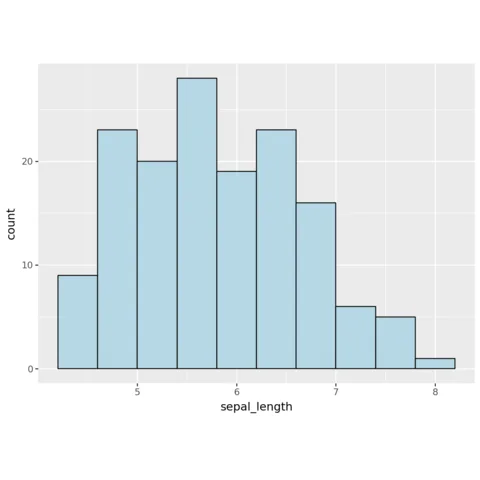
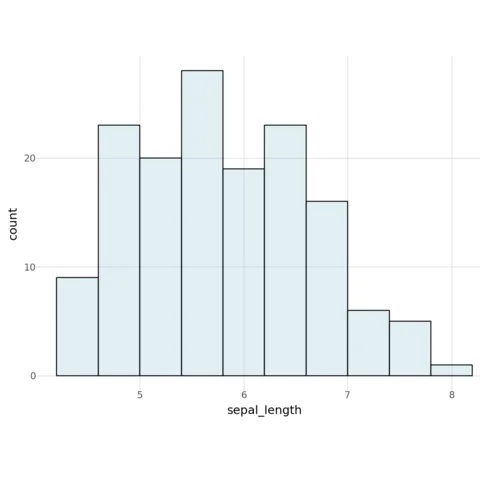
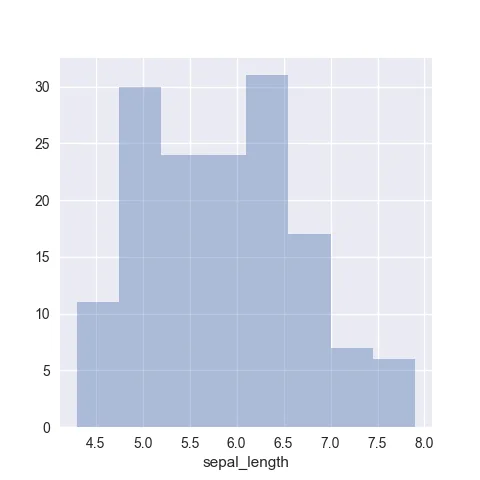
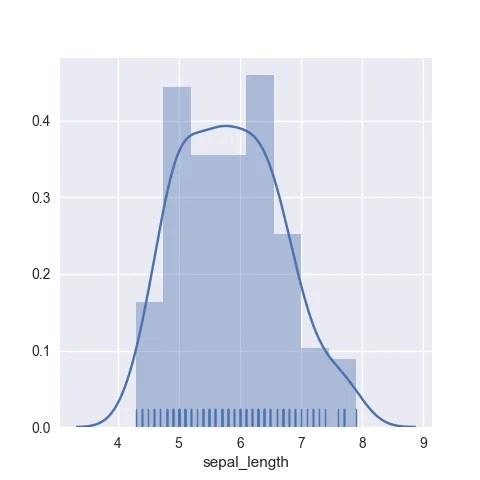
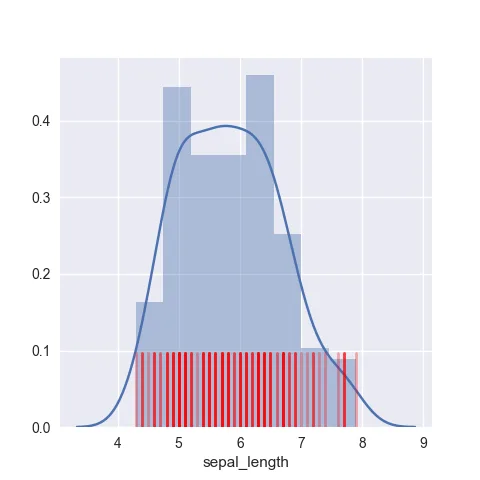
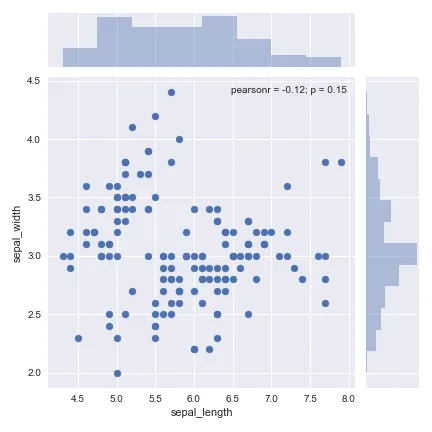
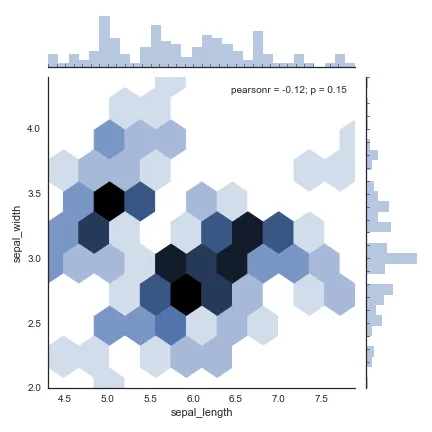
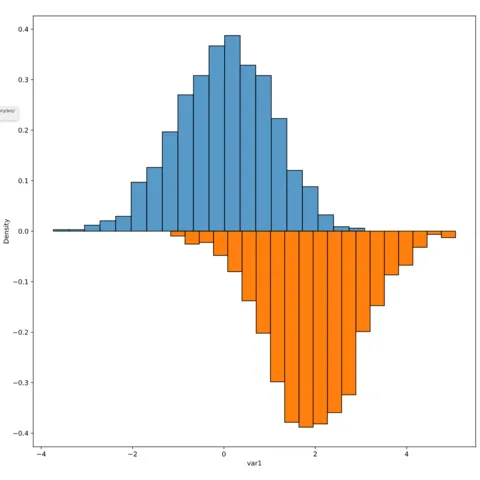
Seaborn is a python library allowing to make better charts easily. It is well adapted to build histogram thanks to its displot function. The following charts will guide you through its usage, going from a very basic histogram to something much more customized.
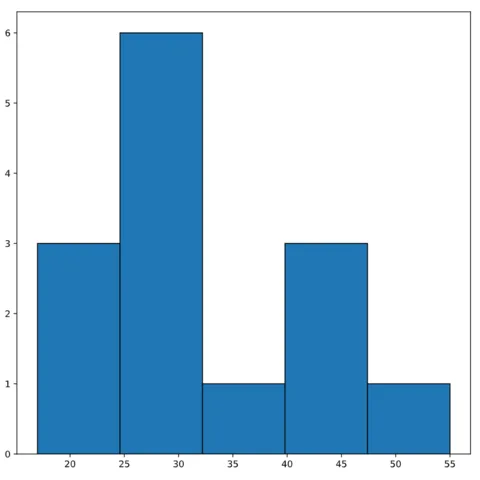
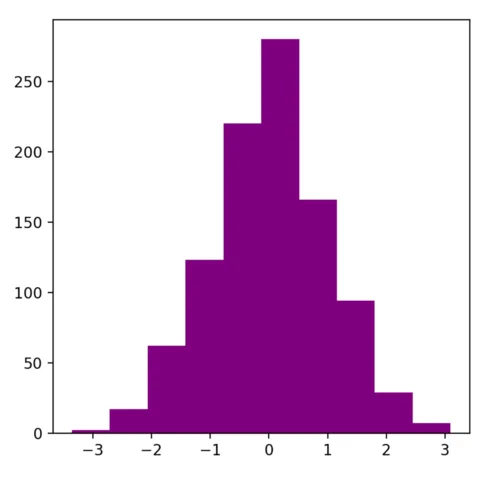
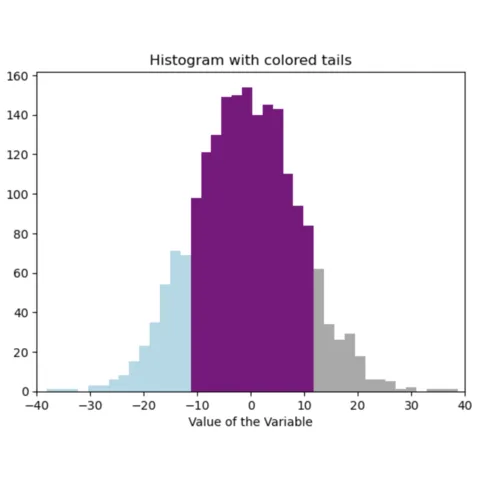
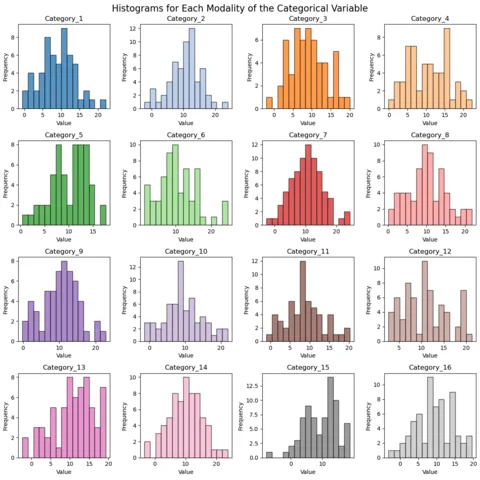
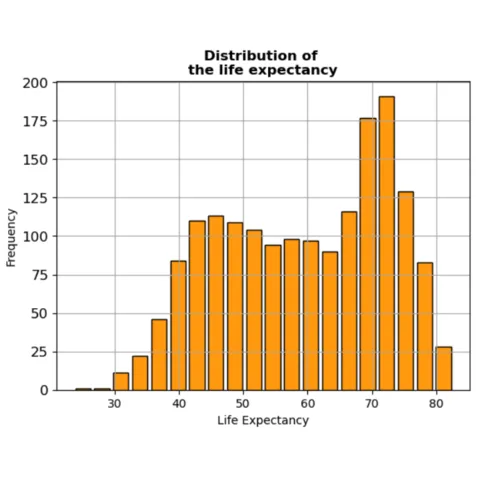
The hist() function of matplotlib creates a histogram to visualize the distribution of a dataset. It plots rectangular bars with heights proportional to the frequency of values in data bins.
As usual matplotlib is perfectly skilled to build nice histogram, but require some more work camparing to seaborn to get a good looking figure.
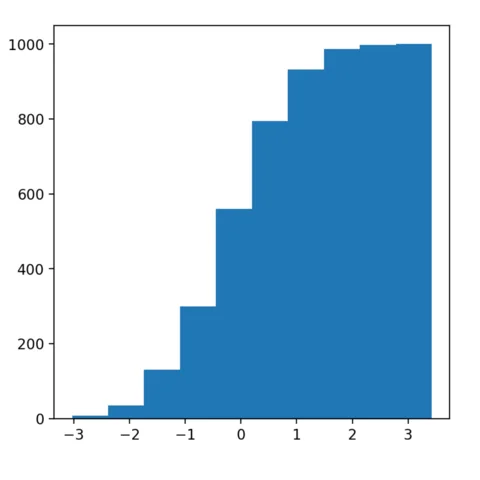
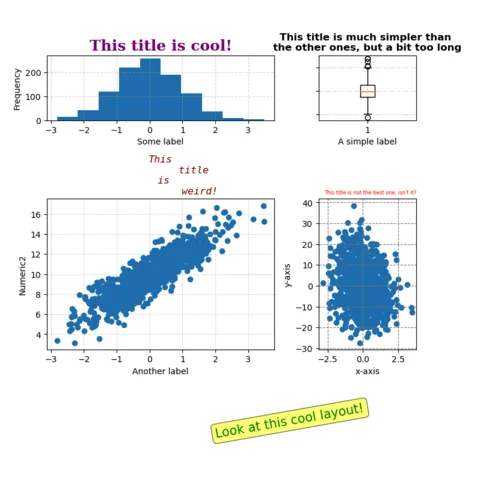
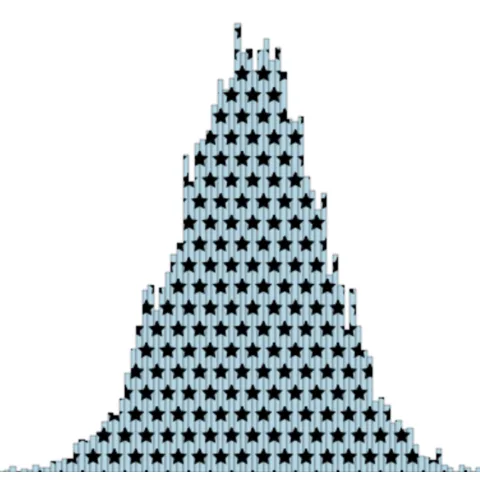
The examples below should help you to get started with matplotlib histograms. They go from a very basic version and then show how to customize it, like adding annotation.
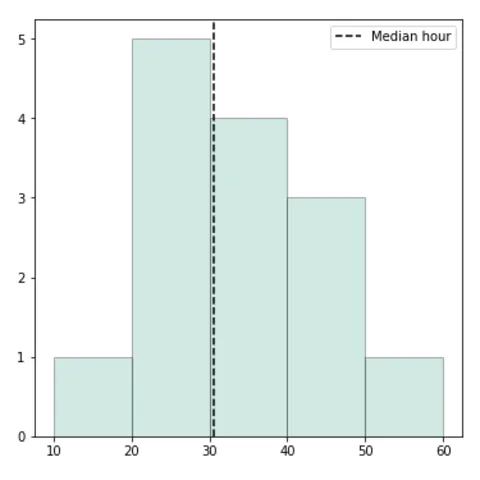
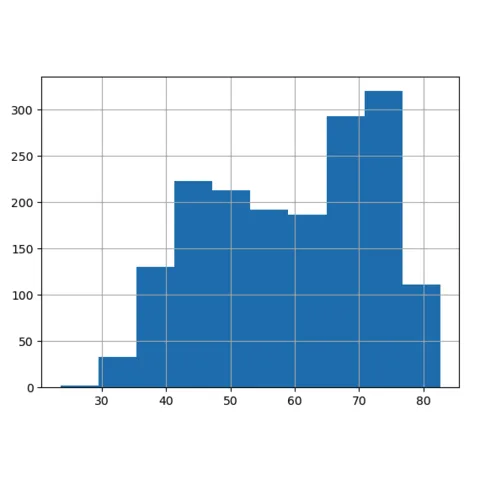
# library & datasetimport pandas as pdimport matplotlib.pyplot as plttime = [17, 25, 42, 35, 26, 27, 20, 11, 22, 32, 35, 30, 45, 55]# Convert to a pandas formattime = pd.Series(time)#plottime.hist()plt.show
Histograms with Pandas
Pandas is not the most common Python library to build histograms, but it can be used to build decent ones. It provides different functions like hist() and plot() from matplotlib.
The web is full of astonishing charts made by awesome bloggers, (often using R). The Python graph gallery tries to display (or translate from R) some of the best creations and explain how their source code works. If you want to display your work here, please drop me a word or even better, submit a Pull Request!
I have spent years collecting the most beautiful data visualizations out there. Get the list of my top 300 dataviz projects, hand-picked, for free.
I respect your privacy. Unsubscribe anytime.
You are visitor 01402503 — GeezerVison does not store the pages you look up. Best viewed with Netscape Navigator 4.7 or Internet Explorer 6 at 800×600. No cookies required.
 Histogram charts with
 Quick start (Matplotlib)
 Quick start (Pandas)
 Histograms with